In project management, lead time is a key metric that measures the total time from when a task is created to when it’s completed. It’s essential for understanding workflow efficiency, identifying bottlenecks, and predicting project timelines.
But how do you track lead time in Jira, the go-to tool for agile teams? And how can you take it a step further by visualizing that data on Gantt charts to improve your project management process?
In this blog, we’ll walk you through calculating lead time in Jira, its importance, and how to use Gantt charts to manage lead time and boost project outcomes. Let’s dive in!

Understanding Lead Time in Jira
Lead Time in Jira refers to the total duration from when an issue (task, bug, feature, etc.) is created to when it is considered completed (typically when it reaches the “Done” or “Resolved” status). It’s a comprehensive measurement of the entire lifecycle of an issue, encompassing both the time spent actively working on it and the waiting periods between stages in the workflow.
Key Elements of Lead Time in Jira:
- Start Point (Creation Time): Lead time begins when a task or issue is created or moved into a specific status (e.g., “To Do”). It marks the initiation of the task or project.
- End Point (Completion Time): Lead time ends when the task or issue is completed and moved to the “Done” status (or any equivalent status, depending on the workflow). This indicates that the work has been finished and is ready for delivery or release.
- Workflow Stages: Lead time accounts for all the stages in the workflow that a task passes through, such as “In Progress,” “Review,” and “Testing.” Each stage contributes to the overall lead time, helping teams identify where time is being spent.
Why Lead Time Matters in Jira
Lead time is a crucial metric in Jira because it provides insights into how efficiently tasks are moving through your workflow. Here’s why it matters:
- Tracking Efficiency: Lead time measures how quickly tasks are completed, helping teams assess workflow efficiency and identify delays.
- Identifying Bottlenecks: It helps pinpoint where tasks are getting stuck, enabling teams to address bottlenecks and optimize processes.
- Improving Forecasting: Historical lead time data helps predict future task completion times, improving project timeline accuracy.
- Enhancing Resource Allocation: Teams can use lead time to adjust workloads and ensure resources are properly allocated.
- Optimizing Workflows: Continuous tracking allows teams to fine-tune their processes, leading to faster delivery.
- Fostering Transparency: Lead time promotes accountability by showing task progress and encouraging team collaboration.
- Supporting Agile Metrics: It complements other agile metrics, providing a comprehensive view of team performance for continuous improvement.
In summary, lead time in Jira helps teams optimize efficiency, improve planning, and deliver projects on time.
Lead Time vs Cycle Time: Key Difference
It’s essential to differentiate between Lead Time and Cycle Time, as they are both important but measure different aspects of work.
1. Lead Time
- Measures the total time from when an issue is created to when it is completed.
- Includes both active working time and any waiting periods between workflow statuses (such as when issues are sitting idle in the “To Do” state).
- It’s an end-to-end measure that gives a broader picture of how long it takes to complete work.
2. Cycle Time
- Focuses only on the active time spent working on the issue, excluding any idle or waiting periods.
- Measured from the moment an issue starts being worked on (e.g., moves to “In Progress”) until it is completed.
- It gives a more focused view of how long it takes to actually complete work once it’s started.
Key Difference: Lead time is a broader measure that includes both waiting time and working time, whereas cycle time focuses solely on the actual work time.
Methods to Calculate Lead Time in Jira
Calculating lead time in Jira — the duration from issue creation to completion — can be done through several methods, depending on your team’s needs and technical setup. Below are four effective approaches to measure lead time in Jira, leveraging its built-in features, plugins, and query capabilities.
1. Manual Calculation (Less Common for Large-Scale)
Manually calculating lead time involves extracting key data from Jira’s issue details:
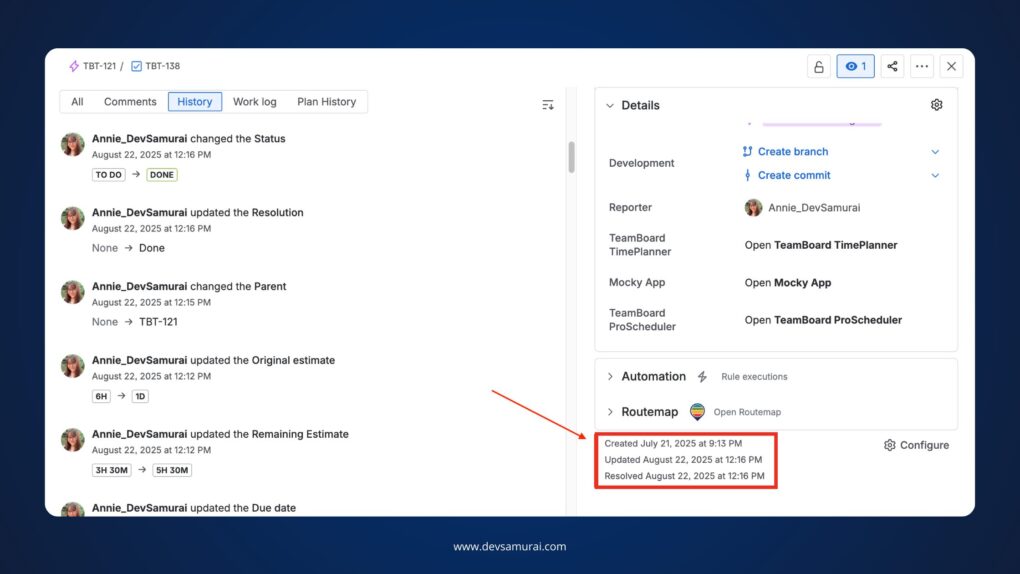
- Step 1: Open the issue in Jira and note the Created Date (when the issue was logged) and Resolution Date (when it was marked “Done” or “Closed”).
- Step 2: Check the issue’s history or audit log (available in the issue view under the “History” tab) to confirm these dates.
- Step 3: Calculate lead time using the formula:
Lead Time = Resolution Date – Created Date.
For example, if an issue was created on July 21st, 2025, and resolved on August 22nd, 2025, the lead time is 32 days.
Note: This method is practical for individual issues but becomes cumbersome for large-scale projects with numerous tasks.
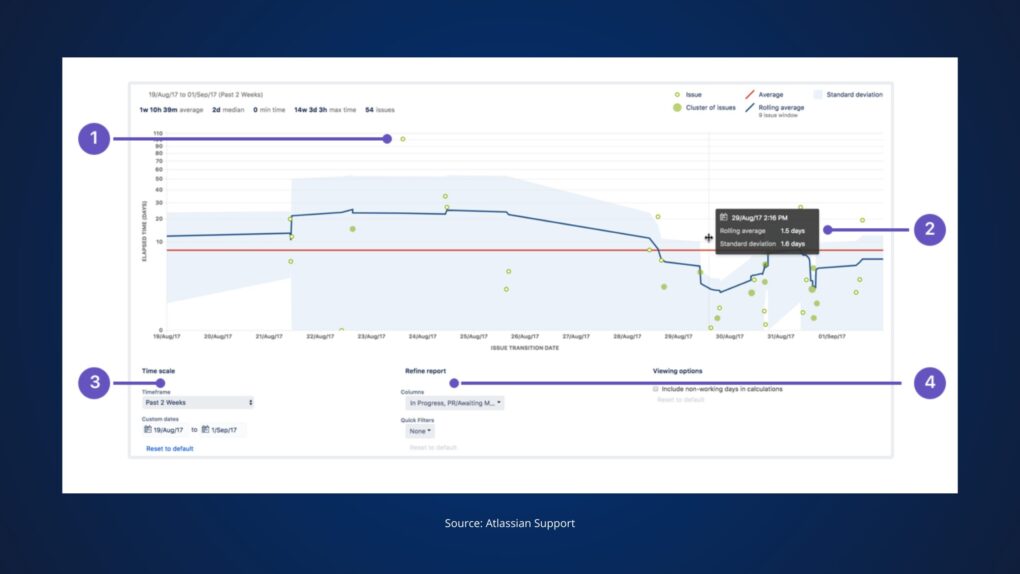
2. Using the Built-In Jira Control Chart
The Control Chart is a built-in Jira tool that visualizes the time taken for issues to move through various statuses:
How to Use:
- Go to your Jira board and select Reports.
- Choose the Control Chart.
- Configure the report to display the time it took for issues to move from “To Do” to “Done.”
Why It’s Useful: It helps you track lead time for multiple tasks over a set period and identify trends, such as delays or bottlenecks.
Note: The Control Chart provides a visual representation but may require additional configuration to reflect lead time accurately.
(View and Understand the Control Chart here – Jira Cloud Support)
3. Using Jira Query Language (JQL) and Filters
JQL allows you to create custom queries to filter issues based on specific criteria:
How to Use:
- Create a custom JQL query to find completed tasks within a given timeframe, for example:
project = “YourProject” AND status changed TO “Done” AFTER “2025-01-01”
- Export the results to a CSV or use Jira dashboards to view and analyze the lead time.
Why It’s Useful: JQL provides flexibility to customize the data, such as filtering by task type or team member.
Note: This method requires familiarity with JQL syntax and may involve manual calculations post-export.
4. Using Jira Marketplace Add-ons
Several add-ons available on the Atlassian Marketplace offer more advanced and flexible lead time calculation and reporting functionalities. One of the popular ones is TeamBoard ProScheduler:
TeamBoard ProScheduler
Overview:
TeamBoard ProScheduler is a robust project management add-on that provides advanced Gantt chart functionality within Jira. It enables teams to visually manage task dependencies, track lead time, and plan project schedules more effectively. By integrating lead time directly into the Gantt chart, this tool helps teams adjust timelines, plan sprints, and manage milestones with greater precision.

How It Helps with Lead Time:
- Visualizing Lead Time: With TeamBoard ProScheduler for Jira, teams can directly visualize lead time on a Gantt chart, allowing for easy tracking of task durations and interdependencies. This makes it clear how long tasks take to complete and how any delays might affect the overall project timeline.
- Managing Task Dependencies: The add-on allows you to manage task dependencies with flexibility. Adjusting lead time on tasks will automatically update the entire project schedule, ensuring that tasks remain on track.
- Auto-Scheduling: When lead time changes are applied, auto-scheduling ensures that any adjustments are reflected across linked tasks, maintaining an accurate, up-to-date timeline.
This feature is ideal for teams that need to quickly visualize, track, and adjust lead time as part of their project management process.
Follow these steps to add Lead Time in the Gantt chart within ProScheduler:
Step 1: Select the Dependency Link:
Click on the dependency link connecting two tasks on your Gantt chart. This will open the Dependency Details panel.
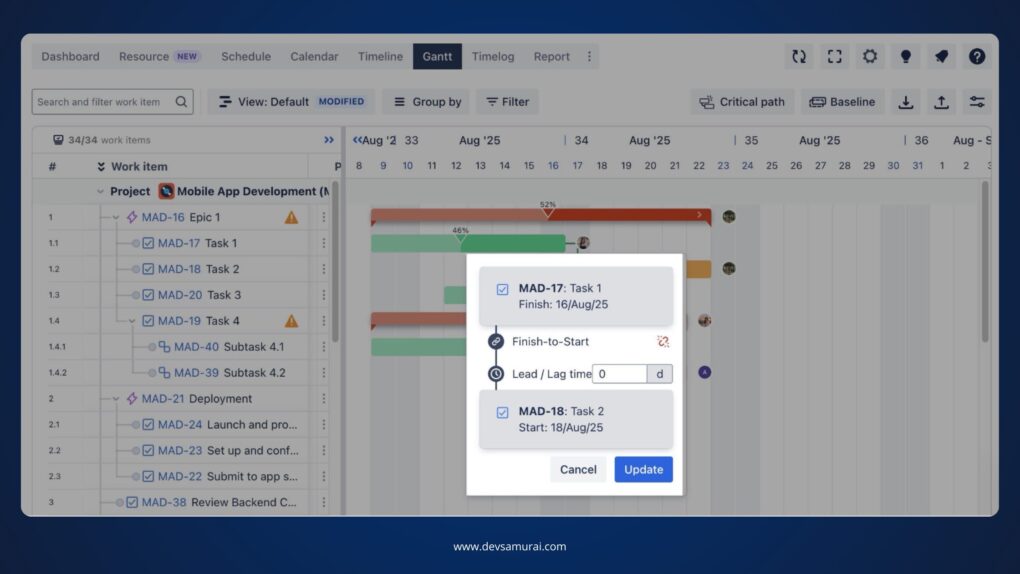
Step 2: Locate the Lead Field:
In the Dependency Details panel, you’ll see the Lead field. This field allows you to define how much earlier the successor task should start relative to the predecessor task.
Step 3: Adjust the Lead Time:
To make the successor task start earlier than the predecessor task, enter a negative number (e.g., -2). This will schedule the successor task to start 2 days before the predecessor task is finished.
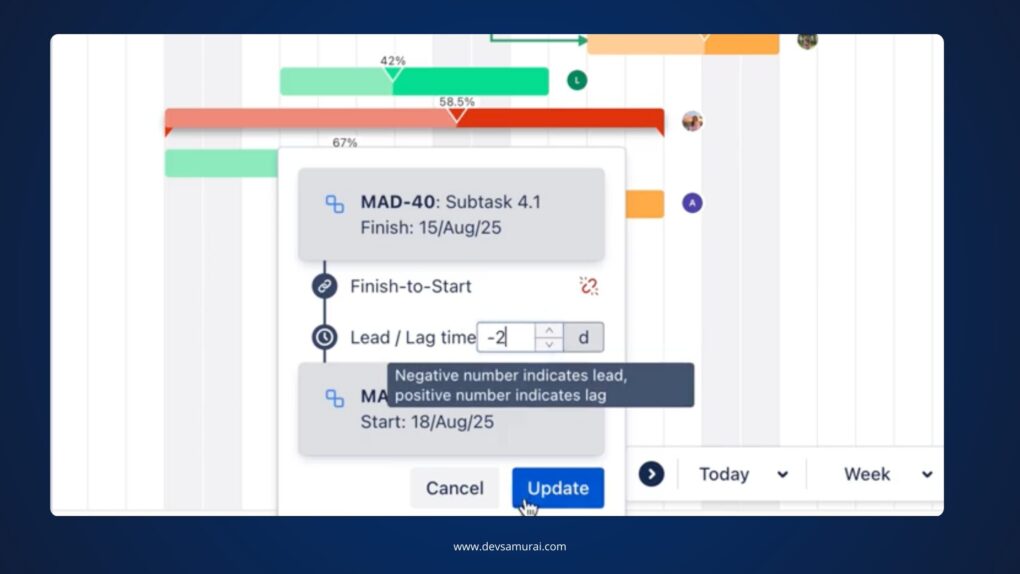
Step 4: Apply Changes:
After adjusting the lead time, click Apply to save the changes. The tasks will now reflect the updated lead time, and the schedule will adjust automatically based on the dependencies between them.
By using the Lead Time feature in ProScheduler, you can fine-tune your project timelines and ensure that tasks are properly aligned, allowing for a more flexible and efficient schedule.
Learn more details here
Conclusion
Understanding and managing lead time in Jira is a key aspect of optimizing your project workflows. By accurately tracking the time it takes from task creation to completion, you gain insights into your team’s efficiency, uncover potential bottlenecks, and improve future project forecasting. Whether you’re manually calculating lead time, using Jira’s Control Chart, or leveraging advanced tools like TeamBoard ProScheduler, you can refine your processes to enhance productivity.
Visualizing lead time in tools like Gantt charts not only improves scheduling accuracy but also ensures a more proactive approach to project management. With the right strategies in place, your team can deliver projects faster, more effectively, and within scope.
Continue Reading
- Top 5 Best Free Gantt Chart Maker Software for 2025
- How to Use a Gantt Chart for Marketing Projects and Campaigns
- 10 Best Project Management Tools – Expert Reviews 2025