Agile project management is a task-oriented approach that promotes flexibility, adaptability, and a customer-first mindset. A key element of agile project management is reporting, which allows project managers and team members to track the progress of their work, assess performance, and make data-driven decisions. This blog post will provide a detailed guide to Agile Reports in Jira, a popular project management tool designed to facilitate agile methodologies.
The Importance of Agile Reports in Jira
Before delving into the specifics of each report type, let’s first appreciate the overarching importance of Agile Reports.
These reports are designed to:
- Visualize work: By presenting complex data in an easy-to-understand format, reports make it easier to track progress and identify trends or issues.
- Assess progress: Comparing actual performance against initial commitments allows for timely interventions and adjustments.
- Review past performance: By analyzing previous performance, teams can identify areas for improvement and implement effective strategies for future work.
- Promote transparency: Clear and comprehensive reports ensure that all stakeholders are on the same page regarding the project’s status and future direction.
- Aid in troubleshooting: Reports can highlight potential issues or bottlenecks, enabling the team to promptly address them.
- Aid in planning and estimating: Through historical data and trend analysis, reports can provide valuable insights for future planning and estimation.
Types of Reports in Jira
Jira provides a variety of reports that cater to different aspects of agile project management. Let’s explore these report types and their benefits.
- Burndown Reports (Present Stage)
- Status Reports (Past Stage)
- Continuous Improvement Reports
Burndown Reports (Present Stage)
1. Burndown Chart
A Burndown Chart tracks the total work remaining in a sprint, showing the actual versus the estimated amount of work. This helps project the likelihood of achieving the sprint goal and aids the team in managing its progress.
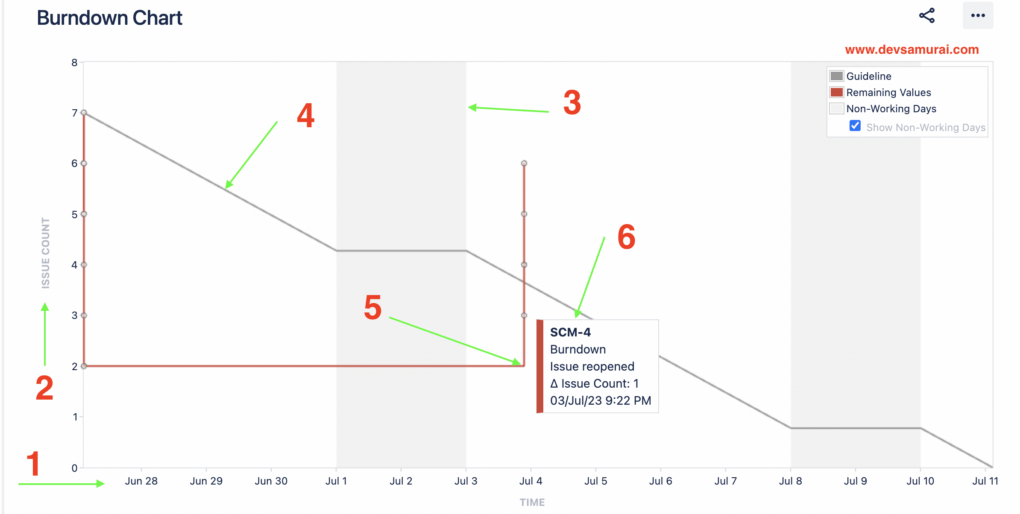
Key Elements:
- Time
- Estimation statistic
- Non-working days
- Guideline
- Actual burndown
- Data point detail
2. Burnup Chart
A Burnup Chart visually represents the progress of a sprint toward completion and can highlight issues related to scope creep. Note, only Story Points on parent tasks are included in this chart.
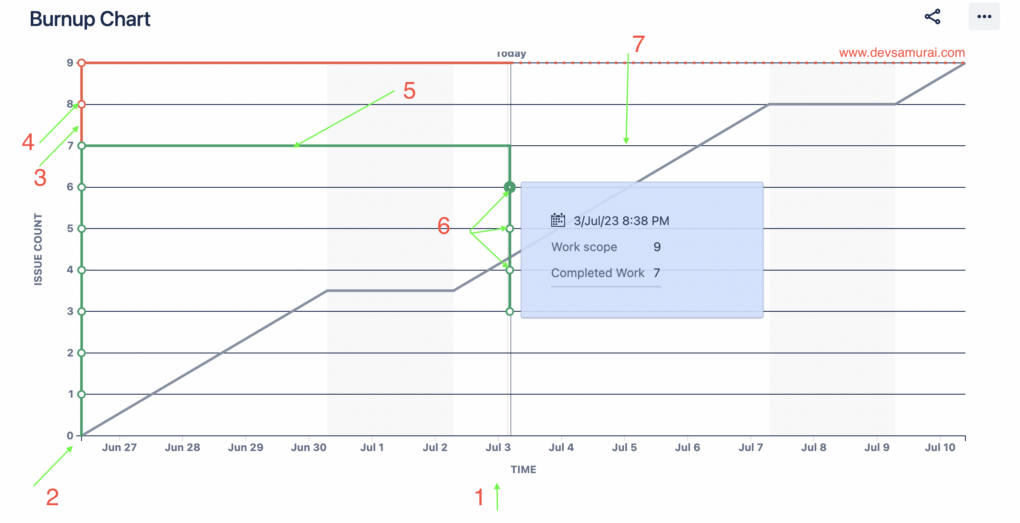
Key Elements:
- X-axis = Time
- Y-axis = Estimation Statistic
- Red = work scope
- Scope changes
- Green = Completed work
- Issue completed
- Guideline
3. Epic Burndown
An Epic Burndown chart indicates how a team is progressing against the work for an epic. It is beneficial in predicting how many sprints it will take to complete the epic’s work.
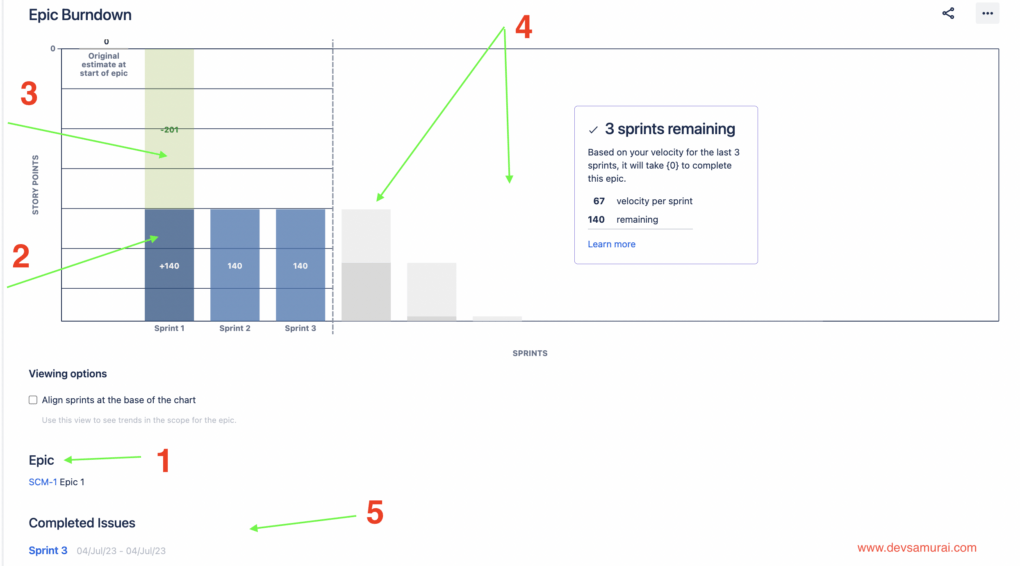
Key Elements:
- Name of Epic
- Light Blue = work remaining at the start of the sprint
- Light Green = work completed during the sprint
- Estimated # of sprints to finish the rest of the issues in this epic
- Table with details of issues completed in each sprint
4. Release Burndown
A Release Burndown chart depicts how the team is progressing against the work for a release. It provides a quick overview of progress and helps predict how many sprints it will take to complete the work for a version.
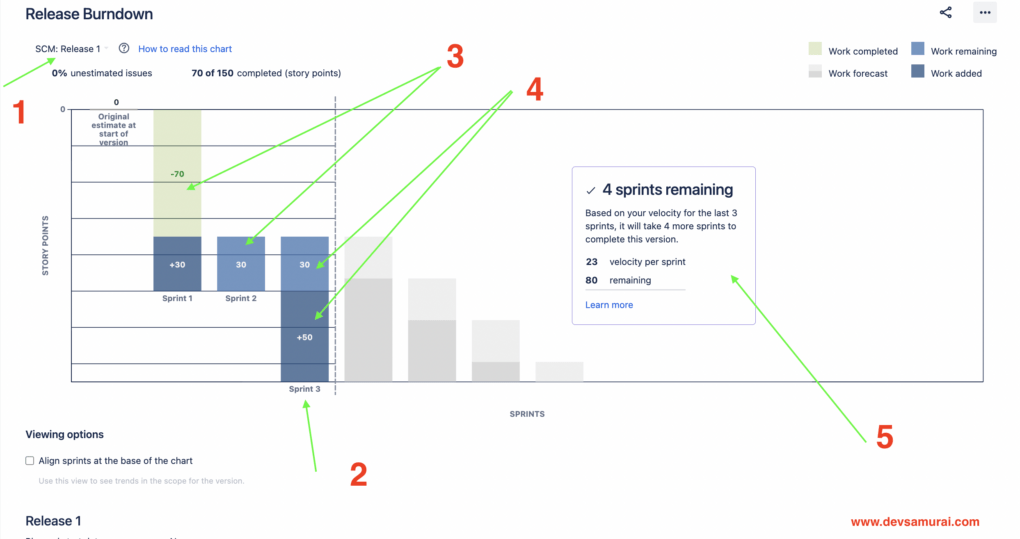
Key Elements:
- Version number
- Dark blue = work added
- Light green + light blue = total work estimated at start of sprint
- Light blue + Dark blue = total work remaining at end of sprint
- Prediction
Status Reports (Past Stage)
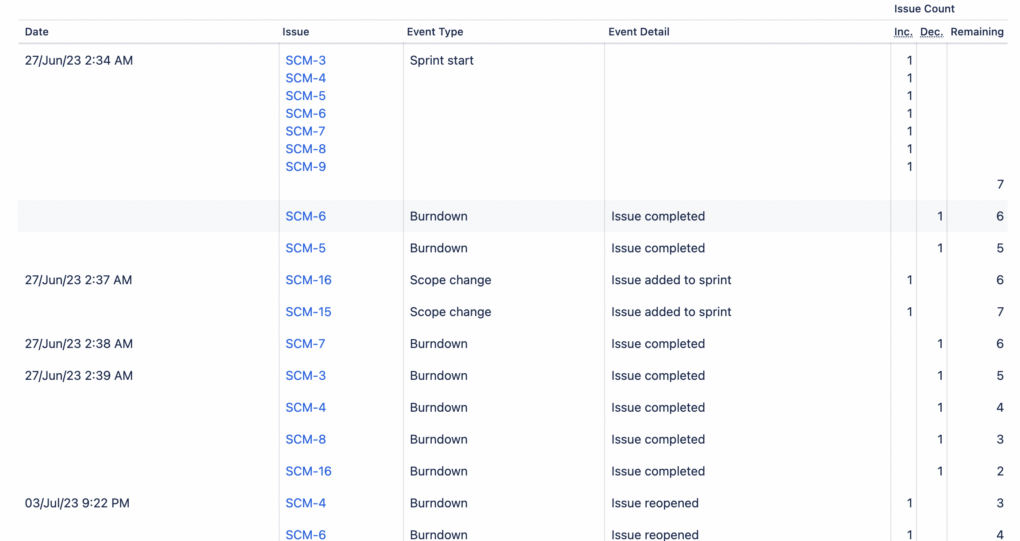
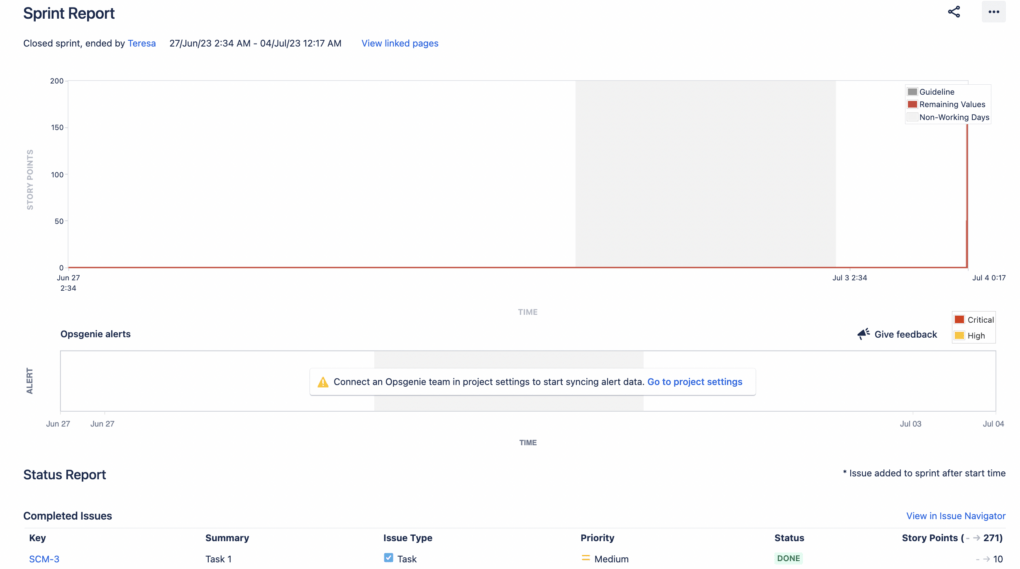
5. Sprint Report
A Sprint Report shows the status of issues in the sprint (completed, not completed) and any scope changes. It is particularly useful for mid-sprint progress checks and sprint retrospectives and can highlight the team’s overcommitment or excessive scope creep.
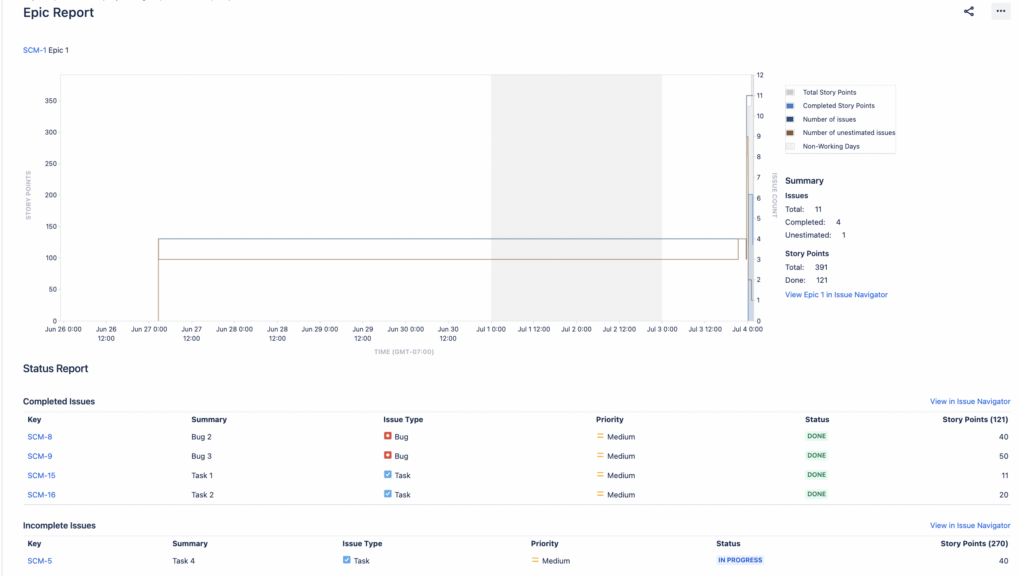
6. Epic Report
An Epic Report provides a list of complete, incomplete, and unestimated issues in an epic. It’s a helpful tool in planning work for an epic that may extend over multiple sprints. This report enables a clear understanding of the progress towards completing an epic over time and helps track the amount of remaining work that’s incomplete or unestimated.
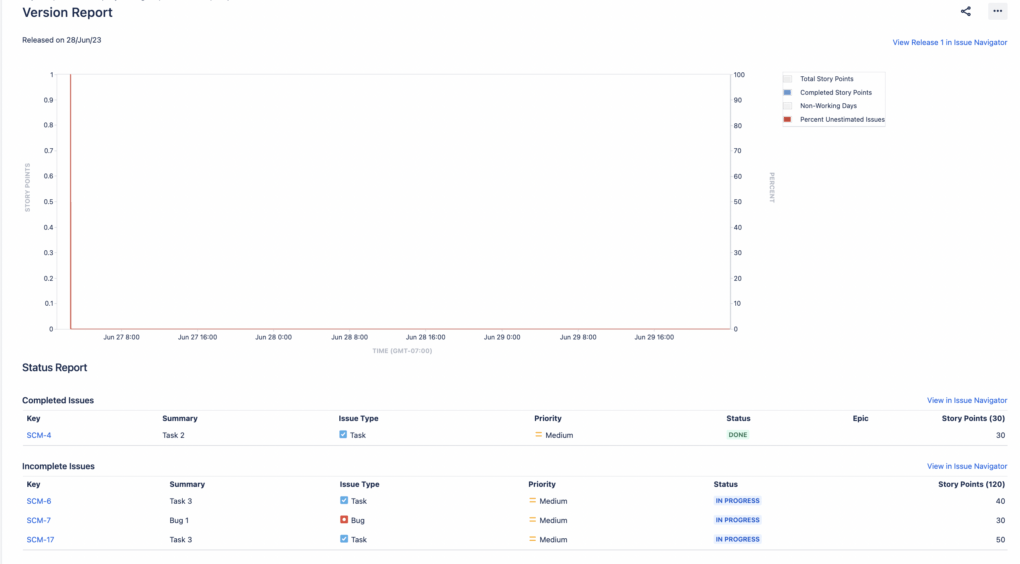
7. Version Report
A Version Report shows the team progress towards completing a specific version and predicts the release date. This report excludes sub-tasks and only shows released but not archived versions. It captures the state of the version at any given point in time in terms of total and completed Story Points and allows visibility into scope changes and progress.
Continuous Improvement Reports
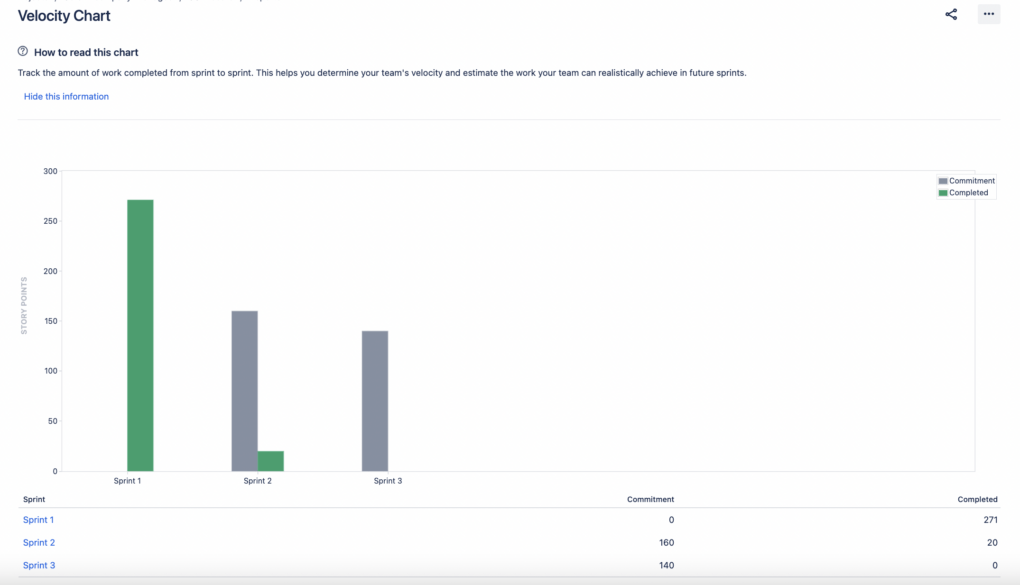
8. Velocity Chart
A Velocity Chart presents the value (sum of estimates) delivered in each sprint, comparing the sprint commitment versus the actual velocity. This report can help predict future work during sprint planning and indicates how velocity generally improves over time as the team gets better at estimating.
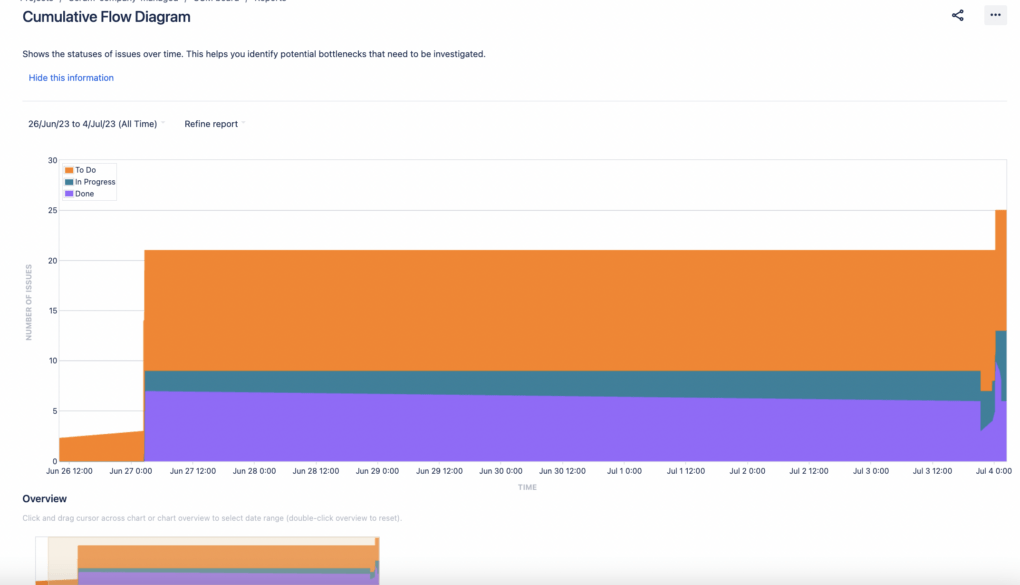
9. Cumulative Flow Diagram
A Cumulative Flow Diagram is an area chart that shows the statuses of work items for a board. It can help identify bottlenecks, show if overall flow is improving, and indicate if the team is keeping up with the backlog. The diagram can be refined using column, swimlane, and quick filter selections.
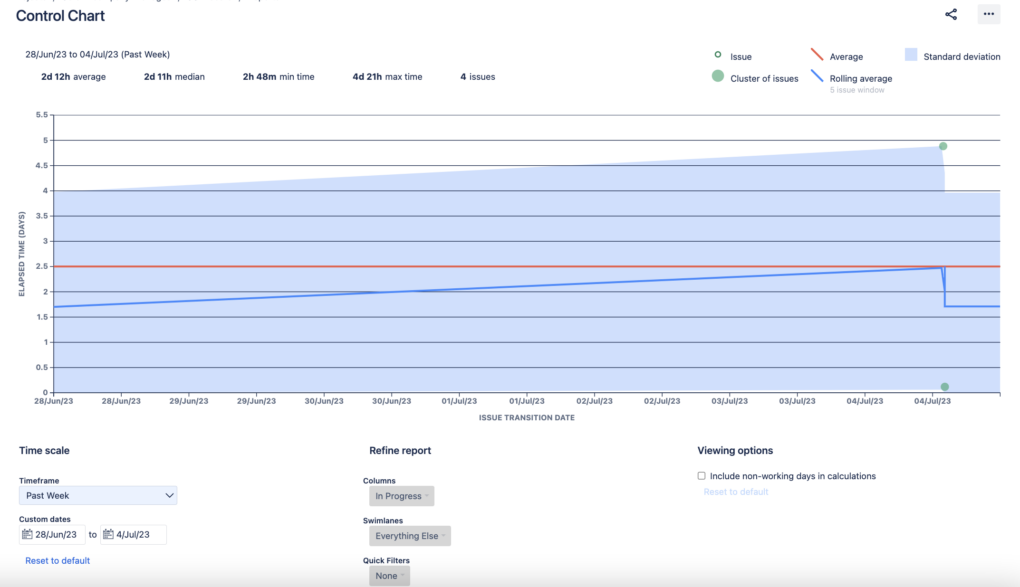
10. Control Chart
A Control Chart shows the Cycle Time (or Lead Time) for the issues on the board, including the average, rolling average, and standard deviation. It helps determine if data from the selected time frame can be used to predict future performance (with less variance being better). This chart can be used to analyze past performance to set targets for your team and measure the effect of a process change on your team’s productivity.
In Agile project management, clear and precise reporting is critical for understanding progress, identifying potential issues, and planning future sprints effectively. Agile Reports in Jira are designed to provide comprehensive insights into all aspects of a project, from the current state of sprints to the rate of completion of epics and versions. By familiarizing themselves with these reports and learning how to interpret them, teams can greatly enhance their agility and productivity.