What is WBS Gantt chart
A WBS Gantt chart is a type of project management tool used to visualize the tasks associated with a project. It is a popular tool used by project managers to keep track of progress and ensure that deadlines are met.
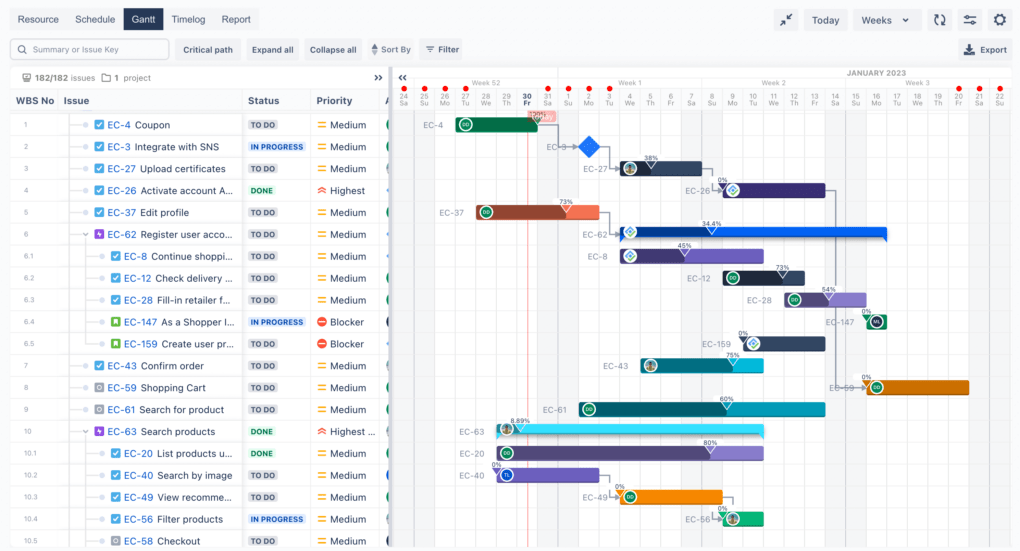
The WBS Gantt chart is a visual representation of the project’s work breakdown structure (WBS). This means it shows the tasks that need to be completed, the order in which they must be completed, and the duration of each task. It also shows the resources needed to complete each task, as well as any dependencies that must be taken into account.
A WBS Gantt chart is an effective tool for ensuring that the project is completed on time and within budget. It allows project managers to track progress and identify any potential bottlenecks or delays. It can also be used to identify risks and develop contingency plans.
The WBS Gantt chart can be used to create a timeline for the project, allowing project managers to plan for the future and ensure that tasks are completed in the correct order. It can also be used to manage resources and allocate tasks to team members.
The WBS Gantt chart is a powerful tool that can help project managers stay on track and ensure that their projects are completed efficiently and effectively. It can help project managers identify areas of improvement and develop strategies to ensure that their projects are successful.
How to create effective Gantt charts
While the concept of Gantt charts is simple, the process of creating and managing them can be daunting. Fortunately, with the right preparation and strategy, you can make effective Gantt charts that will help you stay on track and complete your project on time and within budget.
First, you will need to define your project’s objectives. This will help you to break down your project into smaller, more manageable tasks and also provide a timeline for when each task should be completed. After you have your objectives and timeline established, you can start creating your Gantt chart.
When creating your Gantt chart, it is important that you include all of the necessary information. This includes the project timeline, the start and end dates for each task, the duration of each task, the resources needed for each task, and any dependencies between tasks. This will help you manage the project more efficiently and make sure that no important details are overlooked.
In order to ensure that you make an effective Gantt chart, it is also important that you keep it up-to-date. As you progress through the project, you should update the chart with any changes in the timeline, resources needed, and task dependencies. Doing this will help you stay on track with the project and make sure that it is completed on time.
Finally, you should also consider using project management software to create and manage your Gantt chart. Many project management software programs have features that make it easy to create and update Gantt charts, as well as track progress and dependencies.
By following these tips, you can ensure that you make an effective Gantt chart that will help you stay on track and complete your project on time and within budget. With the right strategy, Gantt charts can be a powerful tool for any project manager.
ProScheduler WBS Gantt chart for Jira
ProScheduler WBS Gantt chart for Jira is a powerful Gantt chart add–on for Jira that allows users to plan and track projects, tasks, and resources in a visual format. It provides an interactive graphical interface for viewing and managing tasks, resources, dependencies, and milestones. The Gantt chart can be used to plan projects, track progress, and ensure tasks are completed on time. ProScheduler Gantt chart for Jira is a great tool for project management teams, especially those working with complex projects.