Imagine you’re a project manager juggling a dozen tasks, deadlines looming, and stakeholders asking for updates. Chaos, right?
Then, you discover the Atlassian Gantt chart, and suddenly, your project’s timeline is crystal clear. Whether managing a software sprint or a marketing campaign, Gantt charts in the Atlassian ecosystem can transform how you plan and execute.
In this guide, we’ll walk you through everything you need to know about using Gantt charts in Jira and Confluence, their benefits, and how to make them work for you.
Let’s dive in!
Understanding Gantt Charts in the Atlassian ecosystem
Gantt charts are visual tools that map out your project’s tasks on a timeline, showing start and end dates, dependencies, and milestones. In Atlassian’s world, they’re supercharged by seamless integration with Jira for task tracking and Confluence for documentation.
So whether you’re running Agile sprints or a Waterfall project, Atlassian’s Gantt charts adapt to your needs.
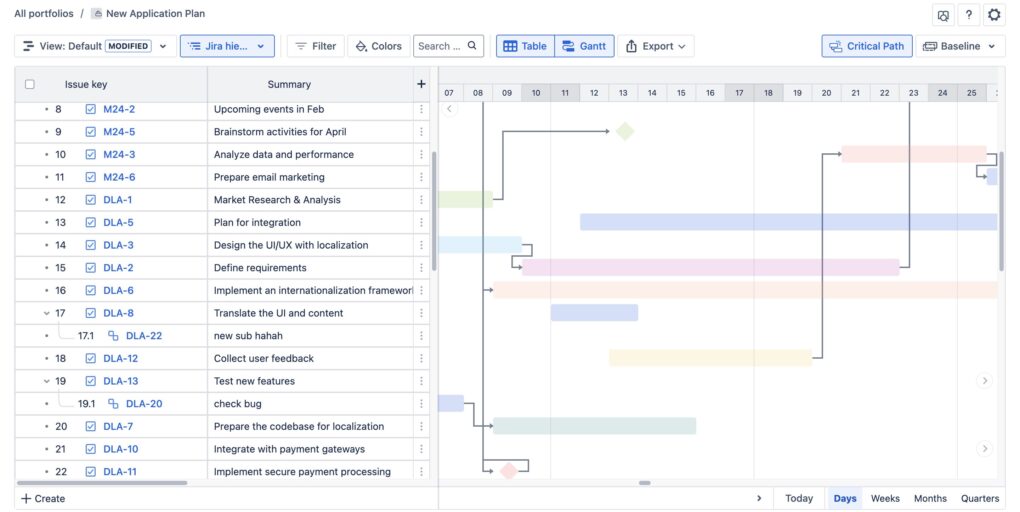
What makes them special? They update in real time as your team logs progress in Jira, keeping everyone aligned. You’ll see tasks on the left and a timeline with colorful bars on the right, showing who’s doing what and when.
Plus, they handle dependencies and milestones like a charm.
You’ve got options: Jira’s native Roadmaps and Advanced Roadmaps (now is Advanced Planning) offer basic Gantt-like views. But if you want advanced features, third-party plugins like GanttTable easily steal the show.
What does “Run on Atlassian” mean?
“Run on Atlassian” is a new badge for qualifying apps on its marketplace in May 2025, introducing a new transparency level and trust for all customers. To acquire this latest badge, all apps need to be built on Forge, Atlassian’s next-generation developer platform.
![]()
Besides, they also must:
- Use only Atlassian’s cloud infrastructure for computing and storage.
- Offer data residency matching the regions of Atlassian apps.
- Enable customers to manage and, if needed, restrict data egress at any time.
For more information about this badge, please visit Atlassian’s Marketplace App Trust.
Benefits of using run on Atlassian Gantt charts
Why should you care about Gantt charts in Atlassian? Here’s the scoop:
- Crystal-clear visualization: See your entire project timeline at a glance—tasks, milestones, and dependencies included. Stakeholders love the big-picture view.
- Team collaboration: Real-time updates in Jira keep everyone on the same page, while Confluence lets you share charts with non-Jira users.
- Resource management: Spot bottlenecks, reallocate resources, and adjust timelines without breaking a sweat.
- Agile-friendly: Plan sprints, track epics, and map dependencies, even in fast-paced Agile environments.
How to create a Run on Atlassian Gantt chart
Ready to build your own Gantt chart? Here’s how to get started with Atlassian’s tools and plugins.
1. Using Jira’s native tools
Jira’s built-in features are a great starting point. For example, Jira Roadmaps is perfect for single-team projects. Open your project, enable Roadmaps, add tasks (issues), set start and end dates, and watch the timeline come to life.
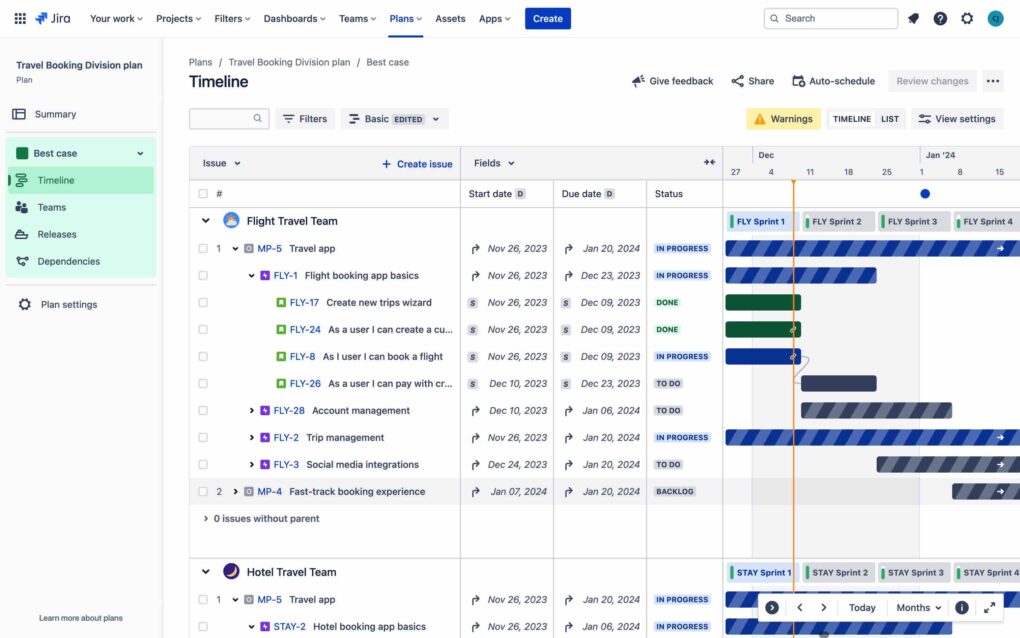
Meanwhile, Advanced Planning is ideal for multi-team projects. It allows visualizing dependencies across teams, planning epics, and tracking progress at scale.
Quick steps:
- Go to your Jira project.
- Enable Roadmaps in the sidebar.
- Add tasks, assign dates, and link dependencies.
- View your Gantt-like timeline and tweak as needed.
2. Using Confluence
Currently, Confluence doesn’t offer a built-in feature for creating Gantt charts. However, you can still display Gantt charts by directly embedding code from external sources into your Confluence pages.
3. Third-party plugins
For advanced functionality, check out this Atlassian Marketplace gem: GanttTable for Jira. It is a fantastic option for teams needing a clean, comprehensive interface while leveraging the power of an advanced spreadsheet to manage Jira issues effortlessly.
It supports table color marking and customizable views, making it perfect for both simple and intricate projects.
Setup guide:
- Head to the Atlassian Marketplace.
- Search for GanttTable or click this [link]
- Install the plugin (it’s currently free).
- Import your Jira projects and issues, configure settings, and start building your run on Atlassian Gantt chart.
Bonus tips:
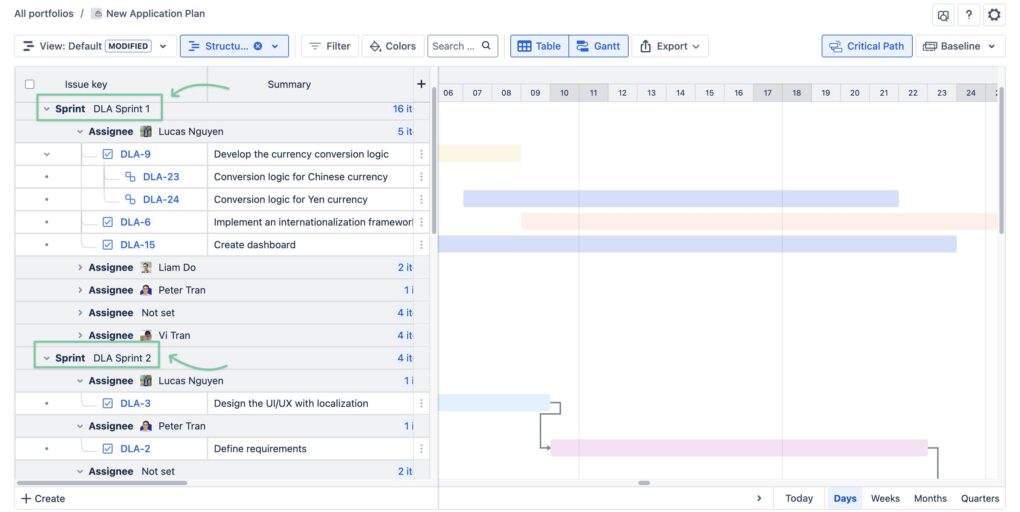
With GanttTable for Jira, you can create different custom structures to illustrate a unique view of your project and workflow. Additionally, you can save that view for later use.
Practical applications across industries
Gantt charts in Atlassian shine across all sorts of projects:
- Software development: Plan sprints, track epics, and ensure releases stay on schedule.
- Marketing: Schedule campaigns, align AI for content creation, and track deliverables.
- Construction/Manufacturing: Use Waterfall-style charts for sequential tasks, like building phases.
- Cross-team projects: Coordinate marketing, sales, and dev teams.
For instance, a marketing team used Confluence Gantt charts to plan a product launch. By visualizing content creation, ad rollouts, and sales handoffs, they kept everyone aligned and hit their deadline.
Best practices for an Atlassian Gantt Chart
To make your run on Atlassian Gantt chart a success, follow these expanded best practices:
1. Start simple and scale gradually
Begin with a small project or a single team to get comfortable with the tool, whether it’s Jira Roadmaps or a plugin like GanttTable. Once you’re confident, scale up to larger, cross-team projects. This approach minimizes overwhelm and builds team buy-in.
2. Define dependencies with precision
You can map task relationships using dependency types like Finish-to-Start (FS), Start-to-Start (SS), Finish-to-Finish (FF), or Start-to-Finish (SF). For example, ensure coding finishes before testing starts (FS).
3. Keep charts updated in real-time
Gantt charts are only as good as their data. Therefore, you should encourage your team to log progress, update task statuses, and adjust dates in Jira regularly. Besides, leveraging automated syncing in plugins ensures your chart reflects the latest changes without manual rework.
4. Collaborate actively with your team
Use Confluence to share Gantt charts with stakeholders or Jira comments to gather team feedback. For example, tag team members in Jira to clarify task details or embed charts in Confluence pages for executive reviews.
Collaboration keeps everyone aligned and reduces miscommunication.
5. Use milestones to anchor progress
Mark key deliverables, like sprint reviews or product launches, as milestones. These act as rallying points for your team and help track major achievements. In GanttTable, you can highlight milestones with distinct markers for extra visibility.
6. Test plugins to find the right fit
To test their features, make sure ot use free trials for GanttTable and other Gantt chart plugins. This is also where you should compare their ease of use, customization options, and integration depth.
7. Communicate with stakeholders effectively
Tailor your Gantt chart views for different audiences. For executives, create high-level charts in Confluence focusing on milestones and deadlines. For teams, use detailed views in Jira with task-level dependencies.
8. Leverage automation for efficiency
Use Jira’s automation rules to streamline updates. For example, rules can be set to adjust task dates when a predecessor task is delayed, or assignees can be notified when tasks are ready to start.
As a result, this reduces manual maintenance and keeps your Gantt chart accurate.
9. Ensure data accuracy upfront
Before building your chart, you must verify that Jira issues have correct start/end dates, assignees, and priorities. Inaccurate data leads to misleading timelines.
That’s why you should spend time cleaning up your Jira project to save headaches later.
10. Iterate and refine your charts
You should treat your Gantt chart as a living document. Review it in sprint retrospectives or project check-ins to identify what’s working and what needs tweaking.
Additionally, you can adjust timelines, dependencies, or resources based on real-world progress to keep your plan realistic.
Conclusion
A “run on” Atlassian Gantt chart can turn chaotic project plans into clear, actionable roadmaps. Whether using Jira’s Roadmaps, Confluence macros, or powerful plugins like GanttTable, you’ve got the tools to visualize tasks, manage resources, and keep your team aligned.
Ready to take control of your projects? Explore Jira, Confluence, or the Atlassian Marketplace today and see how Gantt charts can drive your success.