Jira is one of the most powerful project management tools out there. It’s flexible, scalable, and designed to handle everything from agile sprints to enterprise-wide workflows. But if you’ve used Jira long enough, you’ve probably felt the same pain point as countless other teams: sometimes you just wish you had an Excel sheet right inside Jira.
Exporting data to Excel or Google Sheets works in a pinch, but it’s messy. You lose real-time updates, create multiple versions, and spend way too much time syncing data back and forth. Wouldn’t it be easier if Jira just worked like a spreadsheet when you need it to?
That’s where GanttTable’s advanced table comes in. Think of it as an Excel-like spreadsheet for Jira—a solution built directly inside the platform that lets you keep all the flexibility of Jira with the simplicity of spreadsheets. And thanks to Atlassian’s new user-based pricing model, this kind of tool has just become more affordable than ever.
The challenge of managing projects in Jira
Jira is excellent at tracking issues, epics, and workflows. But let’s be honest: sometimes it can feel like overkill for quick edits and big-picture visibility.
- Need to update the due dates of 50 issues? You’ll be clicking through each one.
- Want to see totals or quick calculations? Jira doesn’t natively handle formulas.
- Trying to sort and filter issues like you would in Excel? You’re limited to Jira’s query language (JQL), which may not be comfortable for everyone to use.
As a result, many teams export Jira issues to spreadsheets. It works… until it doesn’t. Suddenly, you’re dealing with:
- Version chaos: “Wait, which file is the latest one?”
- Data silos: Not everyone has access to your sheet.
- Syncing nightmares: Changes in Jira aren’t reflected in Excel—and vice versa.
What teams really want is spreadsheet-like flexibility without leaving Jira. That’s the gap GanttTable fills.
An Excel-like spreadsheet for Jira experience with GanttTable
GanttTable for Jira brings the best of both worlds: the familiar feel of spreadsheets and the power of Jira’s issue hierarchy. At its core, the table acts like an Excel sheet inside Jira, letting you edit, calculate, and organize tasks without leaving your project environment.
With the Structure feature, you can visualize and manage tasks, sprints, and projects in a way that feels natural. By leveraging Jira’s built-in hierarchies, you can work across multiple projects seamlessly—or even create custom structures to fit your team’s specific workflow. For instance, you can group and total issues by assignee, sprint, or priority, then save these setups as new views for quick reuse.
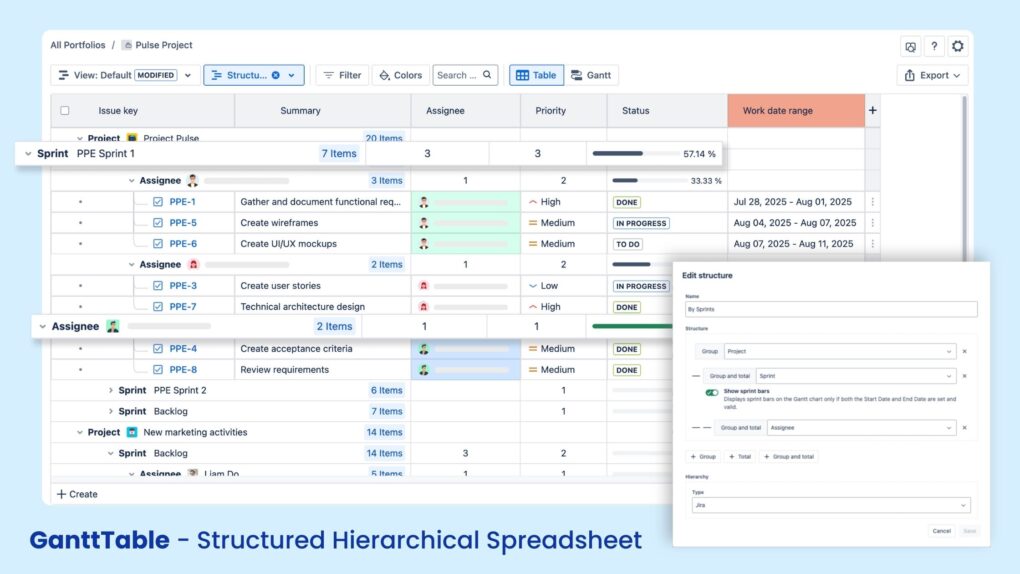
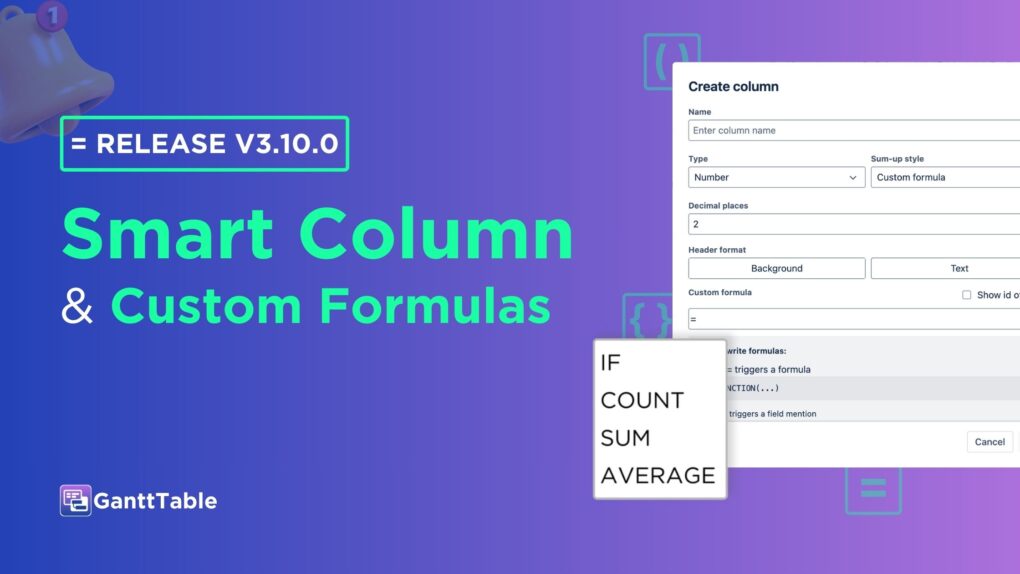
Beyond Jira’s default columns, GanttTable also introduces smart columns, which display calculated or derived values from existing Jira fields. You can choose from prebuilt smart column types or create your own custom versions, complete with formulas that sum up or calculate data exactly how you need it.
The result is a spreadsheet-like environment that feels instantly familiar, while still being native to Jira’s ecosystem.
Advanced features of GanttTable’s Table
GanttTable doesn’t stop at replicating Excel inside Jira. It also enhances it with advanced features designed for agile teams and project managers:
- Custom Smart Columns: Add powerful columns that calculate data automatically. You can choose from different types and apply sum-up styles to display totals, averages, or custom metrics.
- Custom formulas: Go beyond defaults by defining your own rules and formulas to fit unique reporting needs.
- Color marking: Highlight rows, cells, or groups of issues with colors for faster visual recognition. Perfect for marking high-priority tasks or sprint blockers.
- Copy & Paste: Update multiple issues quickly by copying and pasting values across the table.
- Bulk editing: Select multiple issues and make changes all at once, saving hours of repetitive manual updates.
- Switch between views: Move seamlessly from the spreadsheet-like table view to the Gantt chart, keeping both granular data and big-picture timelines aligned at the same time.
- Reusable structures: Save your customized structures as views so you can use them again across projects.
Together, these features make GanttTable not just a table but a dynamic project hub—one where you can analyze, edit, and plan work with the flexibility of a spreadsheet and the reliability of Jira.
Atlassian’s new user-based pricing model
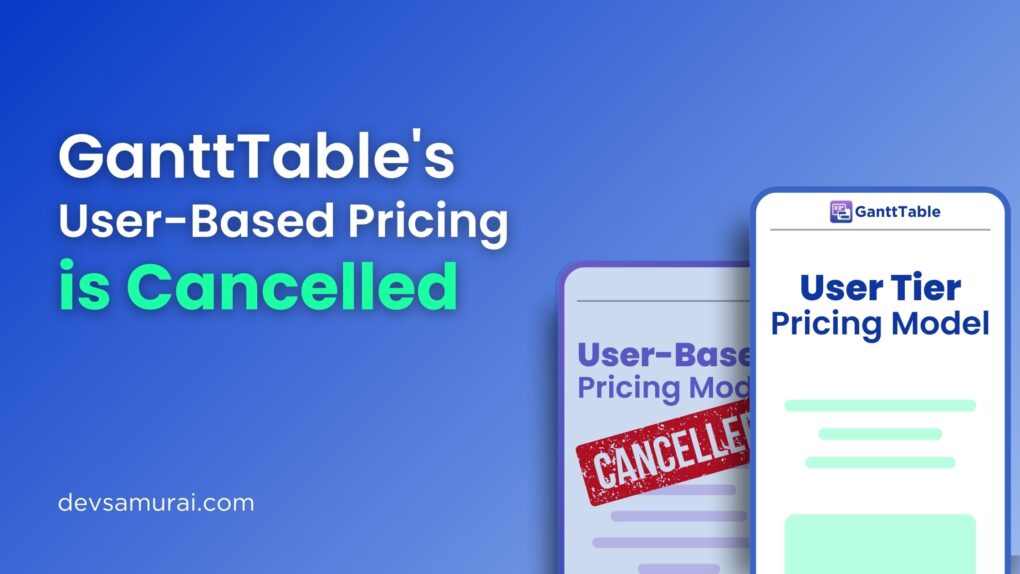
Before we dive into GanttTable’s pricing, let’s talk about a big shift Atlassian announced: the user-based pricing model.
Historically, Atlassian apps were priced based on the total number of Jira users in your instance. This was frustrating for many organizations. Imagine having 1,000 Jira users, but only 100 of them actually needed a specific app—you’d still pay for all 1,000.
It doesn’t sound very reasonable, does it?
Fortunately, the new model changes that. Starting in 2025, Atlassian is rolling out decoupled pricing, meaning you only pay for the number of active app users, not the total Jira headcount in your instance.
Why this matters:
- Fairer pricing: Pay only for those who use the app.
- More flexibility: Assign tools only to the teams that need them.
- Lower costs: Especially for large enterprises where adoption is specialized.
- Customizable stack: Build your Jira environment with a mix of tools tailored to different teams
In short, Atlassian just made it easier (and cheaper) to equip teams with the right apps.
GanttTable pricing under the new model
So, what does this mean for GanttTable? Good news: the app is priced at around $4 per active user per month.
Here’s an example to illustrate the difference:
- If you have 200 users in your instance but only 10 need access to the app, with the new pricing model, you only need to purchase licenses for those 10 users. Unlike other apps, you will need to purchase licenses for all 200 users.
Let’s compare the numbers:
- GanttTable: 10 users x $4 = $40/month
- Other apps: 200 users (tier) x $1.50 per user (Example) = $300/month
That’s a game-changer. It makes advanced project management features accessible to specialized teams without forcing organizations to overspend.
Why choose GanttTable now?
With the combination of an Excel-like spreadsheet for Jira and fair user-based pricing, there’s never been a better time to try GanttTable. Here’s why:
- Familiar interface: Your team already knows how to use spreadsheets. No steep learning curve.
- Native to Jira: Say goodbye to exporting and syncing headaches.
- Cost-effective: At ~$4 per user, it’s an affordable way to upgrade Jira.
- Future-proof: Works seamlessly with Atlassian’s new pricing model, meaning your costs stay aligned with actual usage.
- Empowers all roles: From project managers to developers, anyone can use GanttTable to plan, track, and deliver more effectively.
It’s not just a table—it’s a productivity multiplier.
Conclusion
For years, Jira users have lived with a familiar frustration: needing the flexibility of Excel but the structure of Jira. GanttTable bridges that gap with its advanced, Excel-like spreadsheet for Jira, letting teams collaborate, calculate, and customize their work—all without leaving Jira.
And now, with Atlassian’s user-based pricing model, tools like GanttTable are not only powerful but also accessible and affordable. At just $4 per user, it’s a small investment with a huge payoff in time saved and efficiency gained.
So if you’re tired of juggling spreadsheets and Jira exports, maybe it’s time to stop choosing between them. With GanttTable, you can finally have the best of both worlds—spreadsheet flexibility inside Jira itself.