Choosing the right Gantt chart tool in Jira can make a big difference in how smoothly projects run. Gantt charts give visual timelines of tasks, showing what needs to happen, when, and how tasks depend on each other. This clarity helps teams plan better, spot risks early, and keep work on track.
Jira does not include a built-in Gantt chart, so teams rely on apps from the Atlassian Marketplace. Two notable options are GanttTable and Gantt Charts for Structure PPM.
Each serves different needs: GanttTable offers a powerful blend of spreadsheet-like editing and Gantt visualization inside Jira Cloud, while Gantt Charts for Structure PPM excel at managing complex portfolios within the Structure PPM and Tempo ecosystem.
Understanding Gantt Charts
A Gantt chart is a simple but powerful visual tool that helps teams plan, organize, and track projects. Imagine it as a timeline where all your tasks sit as horizontal bars, showing when they start, how long they take, and when they finish. This timeline view makes it much easier to see the big picture at a glance.
Why does this matter? Because in project management, especially in Agile and portfolio settings, knowing how tasks fit together and when things need to happen is crucial. Gantt charts show how tasks depend on each other — meaning one task might need to finish before another can begin. They help avoid bottlenecks, so delays don’t snowball into bigger problems.
In short, Gantt charts turn complex plans into manageable, visual schedules. This clarity helps teams deliver projects on time, with better coordination and less stress.
→ Read more: Project Management Using Gantt Chart in Jira
GanttTable: Product Overview
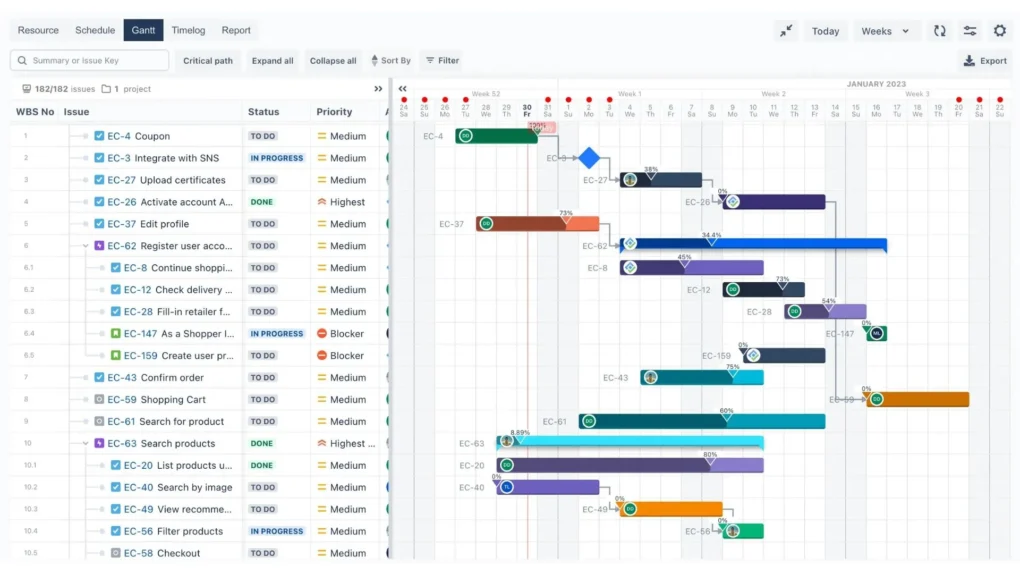
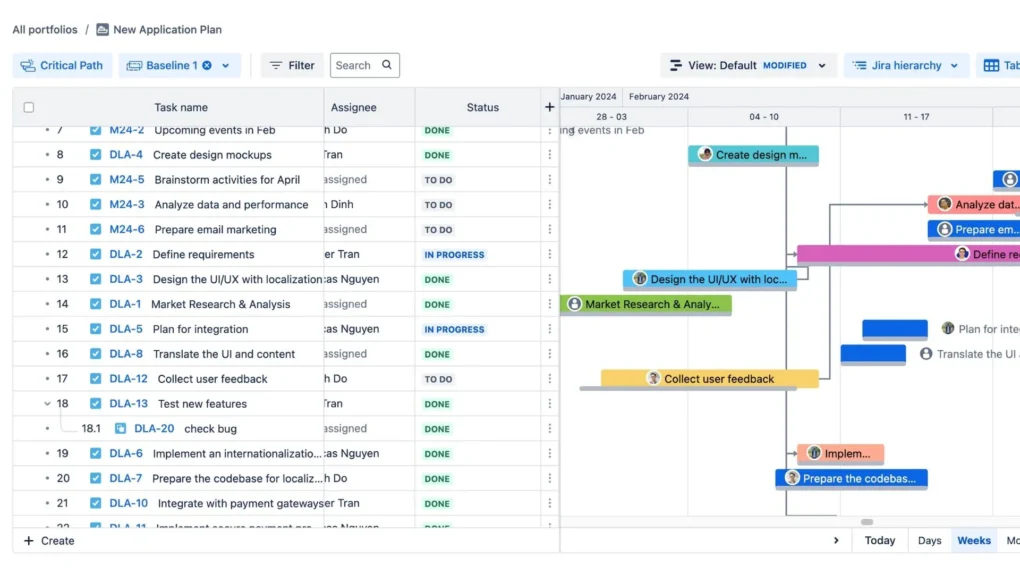
GanttTable is a powerful Jira app that combines the familiarity of spreadsheets with the clarity of Gantt charts—all within Jira. It offers an Excel-like table where you can quickly browse, filter, and edit Jira issues inline or in bulk. You also get useful features like progress bars, and time-in-status tracking to better understand and control your project data.
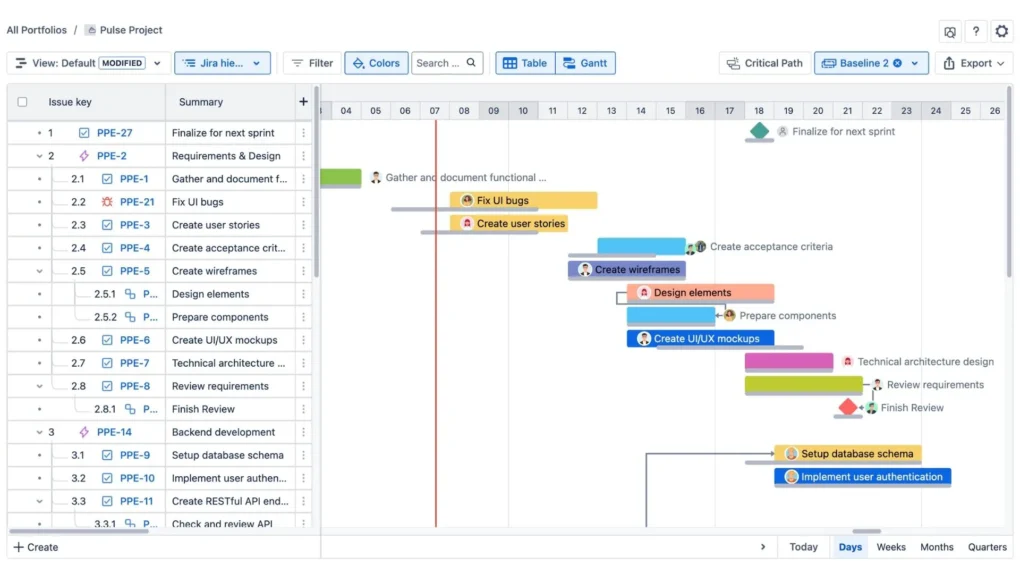
Built natively on Atlassian’s Forge platform, GanttTable ensures smooth performance and strong security on Jira Cloud. It supports custom or Jira-built hierarchies for flexible organization, and the Gantt chart visualizes task timelines, dependencies, milestones, and critical paths. Auto-scheduling helps keep your plan up to date without manual adjustments.
Some highlights of GanttTable include:
- Spreadsheet + Gantt combo: Easily toggle between a detailed table and a visual timeline to fit how your team works.
- Custom hierarchies: Organize work your way with flexible issue structures.
- Portfolio management: Pull together tasks from multiple projects for a high-level overview.
- Secure and native: Built on Atlassian’s Forge platform, it runs smoothly inside Jira Cloud with top security.
- Export options: Share your plans outside Jira with XLSX or CSV exports.
Currently, GanttTable is in free beta, making it a great time to try before it moves to a paid model based on active users.
Gantt Charts for Structure PPM: Product Overview
Gantt Charts for Structure PPM is a specialized extension developed for teams using Structure PPM, a popular portfolio management tool in Jira handled by Tempo.
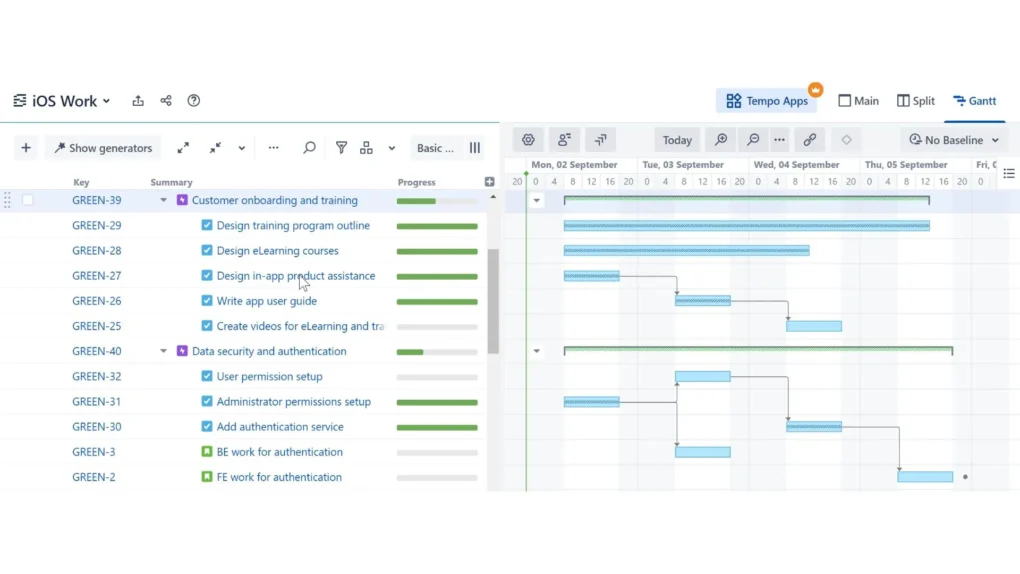
This app provides advanced Gantt chart functions tailor-made for managing hierarchical project structures and roadmaps.
Key features include:
- Task dependencies: Manage relationships with lead and lag times to fine-tune schedules.
- Baseline comparisons: Track planned versus actual timelines easily.
- Resource and workload planning: See team capacity and balance workloads across the portfolio.
- Export and reporting: Create professional reports with PDF and SVG exports, integrated with Tempo’s wider toolset.
Designed for flexibility, it supports Agile and waterfall methods and updates dynamically with Jira issues, making it ideal for enterprises with complex project landscapes.
GanttTable vs. Gantt Charts for Structure PPM: Features Comparison
| Feature | GanttTable | Gantt Charts for Structure PPM |
| Jira Integration | Native Jira Cloud app, built on Atlassian Forge | Extension for Structure PPM & Tempo ecosystem |
| Interface | Excel-style spreadsheet + dynamic Gantt chart | Hierarchical Gantt chart integrated with Structure |
| Task Dependencies | Yes, with drag-and-drop editing | Yes, with lead/lag time settings |
| Milestones | Yes | Yes |
| Baseline Planning | Yes | Yes |
| Critical Path Visualization | Yes | Yes |
| Collaboration & Reporting | Export XLSX and CSV; portfolio dashboards | Export PDF, SVG; Tempo reporting integration |
| Usability | Familiar spreadsheet interface, customizable views | Rich hierarchical and roadmap visualization |
| Scalability & Performance | Suitable for teams needing portfolio views | Handles large nested portfolios |
| Pricing | Free beta transitioning to user-based pricing | Paid app requiring Structure PPM license |
Detailed Comparison
Integration with Jira
GanttTable is a native Jira Cloud app built on Atlassian’s Forge platform. This ensures seamless, secure, and fast performance directly inside Jira with strong alignment to Jira’s Cloud infrastructure.
Gantt Charts for Structure PPM is an extension designed for teams already using Structure PPM, integrating closely with Tempo’s portfolio and resource planning tools. It works only in environments where Structure PPM is established.
Gantt Chart Features
Both tools offer core Gantt chart functionalities:
- Task dependencies and drag-and-drop scheduling
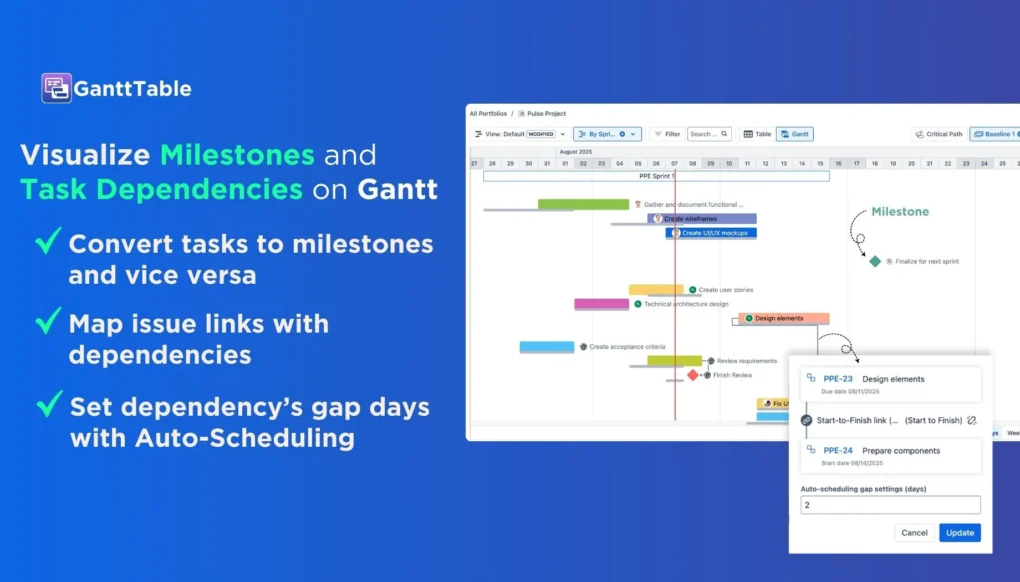
- Milestone tracking to mark important deadlines
- Critical path visualization highlighting the key project timeline
- Baseline planning and progress tracking to compare plans vs actuals
Gantt Charts for Structure PPM provide advanced dependency features, like lead and lag times, allowing for precise scheduling adjustments.
GanttTable uniquely combines a powerful spreadsheet interface with Gantt visualization, allowing for inline edits, formulas, and bulk updates in a table-style view alongside timelines.
Usability and Interface
GanttTable offers a familiar Excel-like experience, making it easy for users comfortable with spreadsheets to manage and manipulate Jira issues with flexibility.
It supports customizable hierarchies and smart columns, making large datasets easier to navigate.
Gantt Charts for Structure PPM emphasize visual hierarchical and roadmap views, ideal for complex multi-layered project structures, with intuitive navigation through nested issues.
Scalability and Performance
GanttTable is great for teams needing portfolio management with easy editing and consolidated views across several projects.
Gantt Charts for Structure PPM are optimized for enterprises handling large portfolios with deep nesting, offering comprehensive resource and workload management.
Pricing and Licensing
GanttTable will transition to a paid app model starting Q4 2025. What makes it different is Atlassian’s new user-based pricing model:
- You only pay for users who actively use the app, not for all Jira users.
- For example, in an organization with 200 Jira users, if only 10 use GanttTable, you buy licenses for those 10.
- At an estimated $4 per user/month, that means a monthly cost of 10 users x $4 = $40.
- Compare that to other apps that typically require licensing for all 200 Jira users, which could be hundreds or thousands of dollars per month, depending on their pricing.
Gantt Charts for Structure PPM require separate licensing for Gantt Charts for Structure PPM and Structure by Tempo, often priced per user or per instance, which may be costlier, especially for large organizations:
- You pay for all users on your Jira instance for both app Gantt Charts for Structure PPM and Structure by Tempo.
- For example, a 200-user Jira instance will cost $512 for Structure by Tempo and $189 for Gantt Charts for Structure PPM, making it a total $701 for both apps.
This fair, usage-based pricing model makes GanttTable a flexible and budget-friendly choice for teams who want to pay only for what they use.
Which Is Better?
Our Choice: GanttTable
We recommend GanttTable as the better option for most Jira Cloud users for several clear reasons:
- All-in-One Convenience: GanttTable combines a familiar spreadsheet-style interface with Gantt chart visuals. This means teams can manage, edit, and visualize their project data without switching tools, making workflow smoother and faster.
- User Friendly: Many people are comfortable working in spreadsheets, so GanttTable’s Excel-like look makes it easy to learn and use right away. This helps teams spend less time training and more time delivering.
- Seamless Jira Integration: Built as a native Atlassian Forge app, GanttTable runs securely and efficiently within Jira Cloud. There’s no need for extra software or complicated setups.
- Flexible and Fair Pricing: GanttTable uses Atlassian’s new user-based pricing model, charging only for actual users who use the app. For example, if your Jira instance has 200 users but only 10 need GanttTable, you only pay for those 10. At $4 per user per month, that’s just $40/month — far less than paying for all 200 users on other apps, which could cost hundreds or thousands each month.
Overall, GanttTable strikes the right balance of power, ease of use, and cost efficiency. It’s a smart choice for teams seeking a flexible, affordable, and intuitive Gantt tool directly inside Jira.
Choose Gantt Charts for Structure PPM If:
- You already use Structure PPM and the Tempo ecosystem.
- Your projects involve complex, deeply nested hierarchies.
- Advanced resource and workload management across large portfolios is critical.
- Enterprise-level reporting tied to Tempo’s tools is a must-have.
Both are great tools, but GanttTable’s ease, affordability, and all-in-one design make it the best starting point for many teams.
Summary
Both GanttTable and Gantt Charts for Structure PPM deliver strong Gantt chart capabilities, but they target different users.
- GanttTable is ideal if you want a flexible, all-in-one tool combining spreadsheet control with dynamic Gantt charts. It’s easy to learn, integrates smoothly in Jira Cloud, and its new user-based pricing means you only pay for active users—making it affordable for teams of any size.
- Gantt Charts for Structure PPM are better suited for organizations using the Structure PPM framework and Tempo tools. It shines at handling large, hierarchical portfolios with advanced resource planning and detailed reporting but can be more complex and expensive.
For teams seeking simplicity, cost efficiency, and an intuitive Jira-native experience, GanttTable is the recommended choice. If your projects demand deep portfolio management within Structure PPM, then Gantt Charts for Structure PPM may be the way to go.
Choosing the right tool helps keep your projects visible, manageable, and on schedule—setting your team up for success.