As Jira becomes the backbone of project tracking for thousands of organizations, project and, especially, portfolio management (PPM) leaders face a common challenge: Jira’s native issue view isn’t always the most efficient way to manage large volumes of work. Teams quickly realize they need spreadsheet-style editing and project scheduling to plan, update, and report at scale.
Two apps frequently enter this conversation: GanttTable vs. JXL. Both enhance Jira with spreadsheet functionality, but they take different approaches. JXL focuses on fast, scalable spreadsheet editing, while GanttTable combines spreadsheets with integrated Gantt charts for true planning power.
In this article, we’ll evaluate both apps from a PPM perspective, compare their features side by side, and share why GanttTable is the more forward-looking choice for most teams.
What is an issue spreadsheet?
An “issue spreadsheet” for Jira is exactly what it sounds like: a spreadsheet interface for Jira issues (or work items). Instead of navigating through Jira’s standard issue screens, users can work in a grid layout where every row represents an issue and every column represents a field. This layout is familiar to anyone who has worked with spreadsheets in Excel or Google Sheets.
Additionally, the benefits of an issue spreadsheet are significant. Teams can update multiple issues at once, create new issues inline, and apply filters, groupings, and aggregations to analyze their data.
From a PPM standpoint, this translates into three core advantages:
- Efficiency: Teams can manage backlogs, sprints, and status updates far faster than opening issues one by one.
- Visibility: Managers can surface insights across large portfolios without needing to build complex custom reports.
- Control: Leaders can view issues in hierarchical structures, such as initiatives, epics, and tasks, to better align day-to-day work with strategic goals.
In short, issue spreadsheets give Jira the speed and flexibility needed for large-scale planning and tracking.
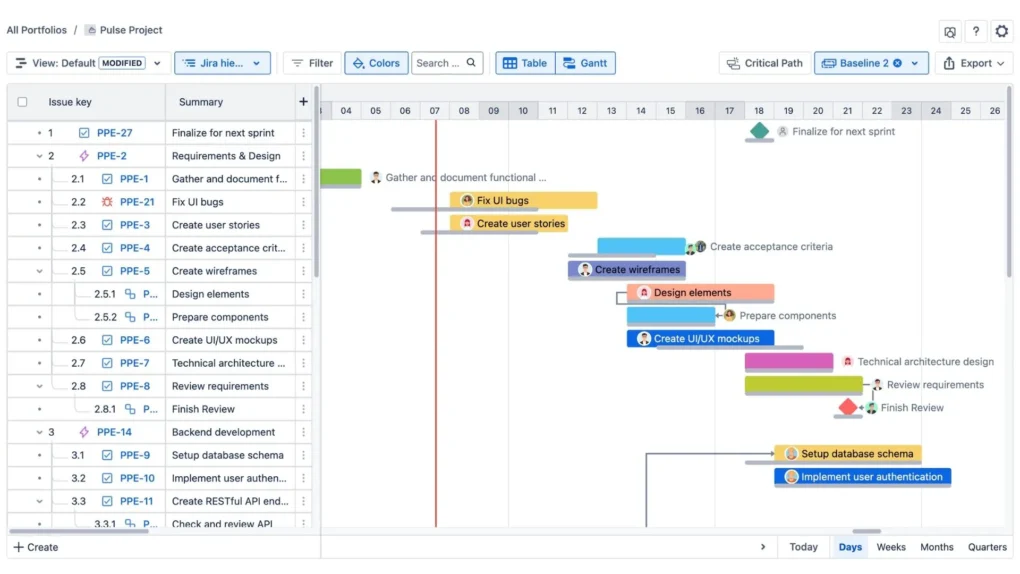
Overview of GanttTable by DevSamurai
GanttTable, developed by DevSamurai, is a newer entrant to the Atlassian Marketplace, but it already offers a unique value proposition. Unlike other spreadsheet-style apps, GanttTable combines a spreadsheet view with an integrated Gantt chart, making it a powerful planning tool inside Jira.
Moreover, one of its standout qualities is that it is built entirely on Atlassian Forge. This means it meets Atlassian’s highest standards for security, compliance, and scalability.
It also carries the “Run on Atlassian” badge, which assures customers that the app is tightly integrated with Atlassian’s cloud architecture. For enterprises concerned about security and long-term sustainability, this is a critical advantage.
Key features of GanttTable:
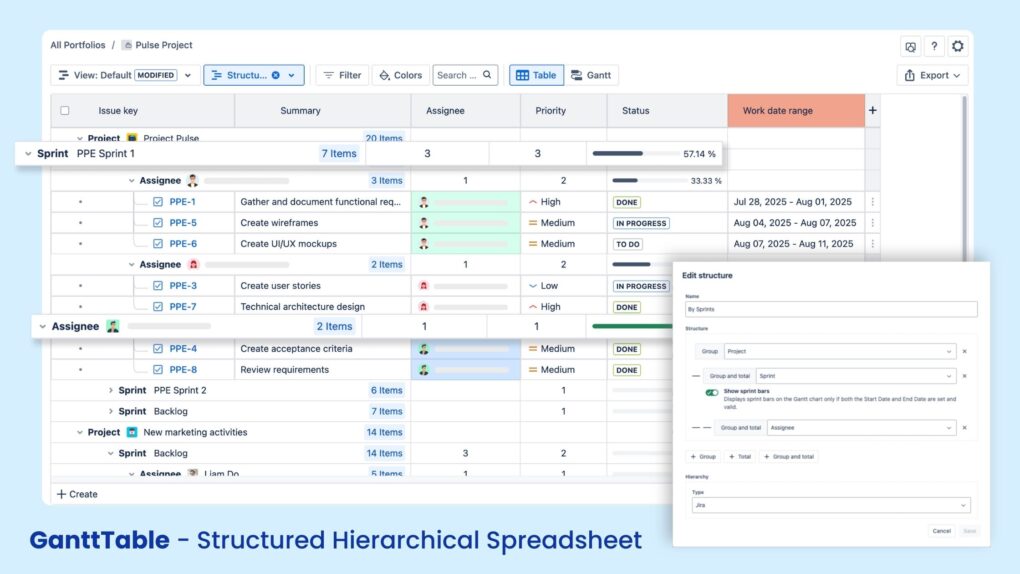
- Spreadsheet View: Users can edit issues inline, apply bulk updates, copy and paste values, and work with smart columns that support functions such as sum, average, minimum, and maximum.
- Custom Formulas: GanttTable allows teams to define calculated fields. This is useful for portfolio metrics such as cost variance or earned value, enabling managers to create KPIs directly in the app.
- Gantt Chart: GanttTable includes a built-in Gantt chart. Teams can visualize timelines, manage task dependencies, set milestones, auto-schedule tasks, and analyze critical paths. This makes it easier to plan, track, and adjust projects.
- Hierarchies and Structures: Users can view issues in Jira’s standard hierarchy or create their own custom structures, such as Portfolio → Program → Project → Epic → Story.
- Conditional Formatting: Managers can highlight risks, deadlines, or priorities by applying formatting rules to rows and columns.
- Aggregations: Data can be rolled up across groups or hierarchies, giving a clear picture of totals and progress without leaving the spreadsheet view.
For portfolio managers, the appeal of GanttTable for Jira lies in its ability to combine task-level detail with schedule-level planning, all in one tool.
Overview of JXL
JXL for Jira is one of the more established apps in the Jira ecosystem. Created by Fine Software, it was acquired by Appfire in 2024, which has significantly boosted its market presence and support.
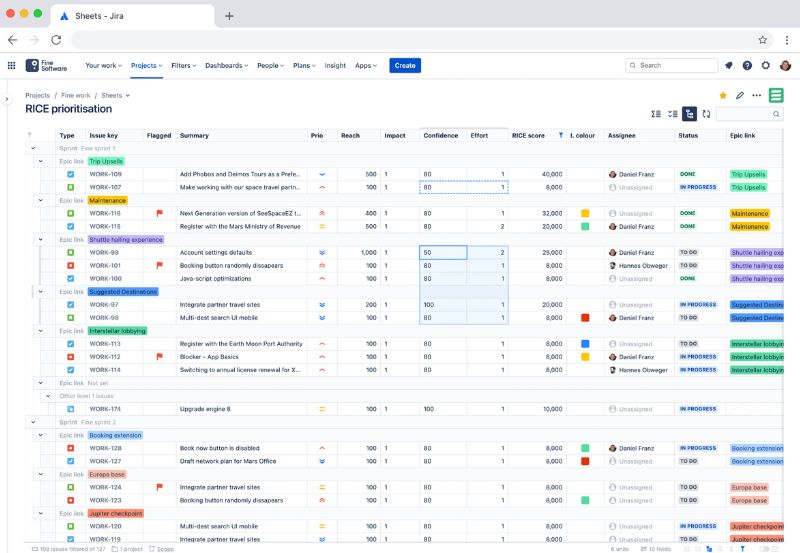
JXL’s mission is clear: to be the fastest and most scalable issue spreadsheet for Jira. It does not attempt to provide scheduling features such as Gantt charts. Instead, it focuses on data manipulation, reporting, and efficiency.
For many enterprises, this simplicity and speed make it a strong choice.
Key features of JXL:
- Spreadsheet Editing: Inline edits, copy-and-paste functionality, and bulk operations make it easy to manage large volumes of issues quickly.
- Custom Structures: Teams can define their own hierarchies and groupings, giving flexibility in how issues are organized and displayed.
- Sum-ups and Aggregations: JXL supports calculations such as totals, averages, medians, and even visual progress indicators.
- History Columns: Unique to JXL is its ability to show “time in status” and other workflow history metrics, which are useful for process analysis.
- Conditional Formatting: Like GanttTable, JXL supports rules to color-code issues based on criteria.
- Saved Views: Users can save particular configurations for future use, making it easier to switch between views.
- Performance at Scale: JXL is optimized to handle thousands of issues at once, with near-instant updates and responsiveness.
GanttTable vs. JXL: A side-by-side comparison
Now let’s cut the chit-chat. Here’s how the two apps stack up across major features:
| Features | GanttTable | JXL |
| Spreadsheet Editing | ✅ With inline edits, bulk changes, and copy/paste | ✅ With inline edits, bulk changes, and copy/paste |
| Smart Column (Aggregations) | ✅ Supported | ✅ Supported |
| Custom Formulas | ✅ Supported | ❌ Not available yet |
| Hierarchy & Grouping | ✅ Jira hierarchy and custom levels | ✅ Jira hierarchy and custom levels |
| Conditional Formatting | ✅ Supported | ✅ Supported |
| Time in Status | ❌ Not yet. Will be implemented in the future | ✅ Supported |
| Gantt chart | ✅ Fully-featured Gantt chart | ❌ No |
GanttTable vs. JXL: Price comparison
Pricing is always a key factor for portfolio leaders making tool decisions.
JXL follows a traditional paid app model in the Atlassian Marketplace. Its price varies by the number of users, but as the team size increases, so does the cost. For large organizations, this can represent a significant investment.
- For example: your organization has 100 users, but only 10 users use JXL, you still have to pay $188 monthly for a 100-user license.
Meanwhile, GanttTable (currently free) will become a paid product starting Q4 2025, and it will follow Atlassian’s new user-based pricing model. This model is designed to be more flexible and transparent. This is where it makes GanttTable’s pricing appealing:
- You only pay for active users who actually use the app, not for every Jira user in your instance.
- So if your organization has 100 Jira users, you only have to pay for those 10 users who use GanttTable.
At an estimated price of $4 per user per month, that means the app costs you just $40 monthly for those 10. Now that’s a big difference.
For portfolio managers managing budgets, this difference is substantial. GanttTable lowers the barrier to entry, allowing organizations to experiment before committing to long-term costs.
So, which app should you go for?
When comparing GanttTable vs. JXL, both have their strengths, but the decision ultimately depends on your needs.
Our pick? We chose GanttTable for Jira. If you are looking for a complete planning solution inside Jira, you can never go wrong with GanttTable.
Here are the three major advantages the app can offer.
1. Forge-native with Run on Atlassian badge
By running fully on Atlassian’s Forge platform, GanttTable ensures maximum security, compliance, and performance. This is important for organizations that take data governance seriously.
2. Spreadsheets and Gantt in one app
GanttTable combines data editing and scheduling in a single solution. Instead of purchasing and integrating multiple apps, teams can do both within one interface.
As a result, this saves time, reduces costs, and simplifies workflows.
3. Aligned with Atlassian’s new pricing model
GanttTable adopts the new user-based pricing approach, which is more transparent and cost-effective. Small teams benefit from free access, while larger teams get predictable scaling.
For PPM leaders, consolidating tools is always a priority. The fewer apps you need, the easier it is to manage training, governance, and integrations. GanttTable delivers this consolidation by merging spreadsheets and Gantt charts into one tool.
Conclusion on comparing GanttTable vs. JXL
Both JXL and GanttTable improve Jira with powerful spreadsheet capabilities, but they serve different purposes. JXL is a solid choice if all you need is lightning-fast spreadsheet editing at scale.
However, for teams that want more than data manipulation, GanttTable clearly stands out. By combining spreadsheets with Gantt charts, running fully on Atlassian Forge, and embracing Atlassian’s new pricing model, it delivers both flexibility and planning power in a single app.
For PPM leaders, that means fewer tools to manage, lower costs, and clearer alignment between strategy and execution. If you’re serious about taking Jira from issue tracking to true project and portfolio management, GanttTable is the smarter investment—and now is the best time to try it.