If you’re managing projects in Jira, you’ve probably realized that Jira’s boards alone aren’t always enough. That’s where Gantt chart apps come in. They give you a visual timeline, help you track dependencies, and keep your team aligned.
Two of the most popular apps for this are GanttTable (by DevSamurai) and WBS Gantt Chart for Jira (by Ricksoft). Both tools bring structure and clarity, but they serve slightly different needs. Let’s break it down.
Quick Glance: Why Compare GanttTable and WBS Gantt Chart?
Both of these apps extend Jira with Gantt chart functionality, but they’re designed with different priorities in mind.
- GanttTable focuses on simplicity, speed, and modern design. It combines a spreadsheet-style table with a timeline view, giving users a straightforward way to plan without overwhelming them with extra features.
- WBS Gantt Chart for Jira is more like Microsoft Project inside Jira. It’s feature-heavy, designed for traditional project managers who need baselines, critical paths, resource management, and exports.
They’re often compared because many teams ask the same question:
👉 Do we need a lightweight, modern tool or a full-featured, traditional one?
Let’s take a closer look at each app.
What is GanttTable?
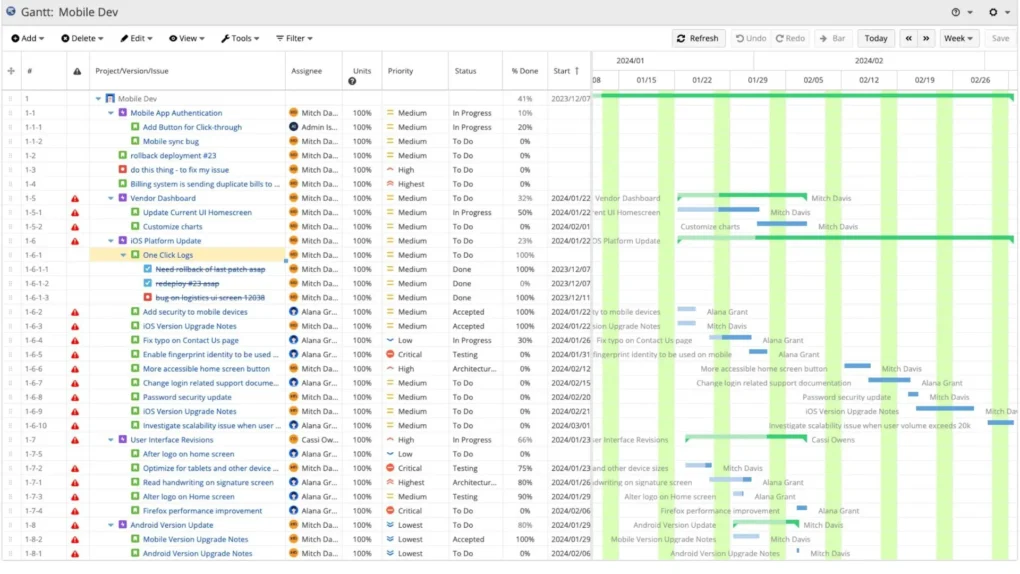
GanttTable is a Jira app from DevSamurai that combines a familiar spreadsheet interface with a Gantt chart timeline. Instead of juggling multiple tools, you can edit issues directly in a table view and instantly see the impact on your schedule. The design makes it easy for non-project managers to jump in without training.
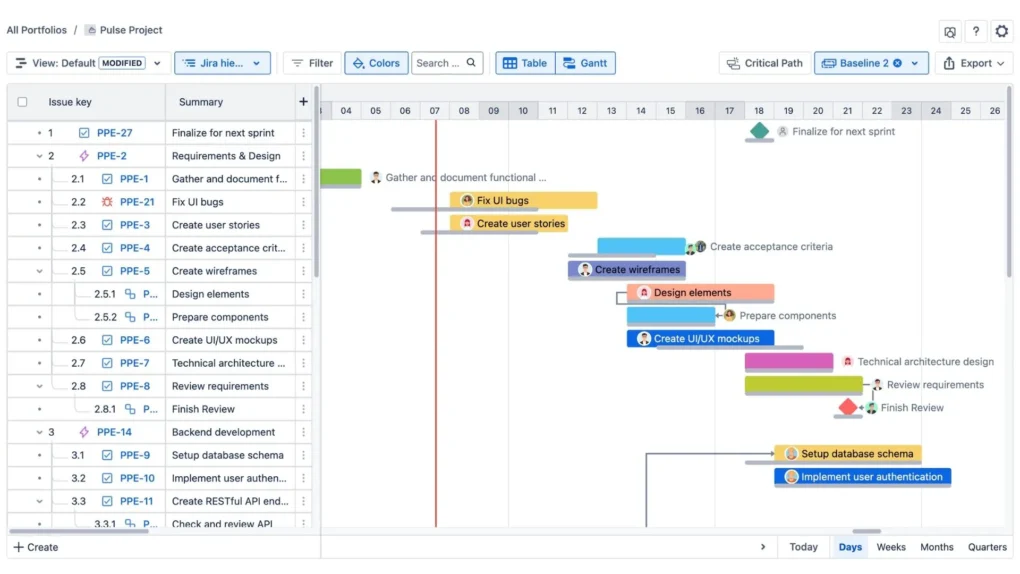
It supports essentials like dependencies, milestones, critical path, and baselines, so you still get the power of structured planning. But it keeps the experience streamlined—ideal for teams who want clarity without the weight of a full project management suite.
What is WBS Gantt Chart for Jira?
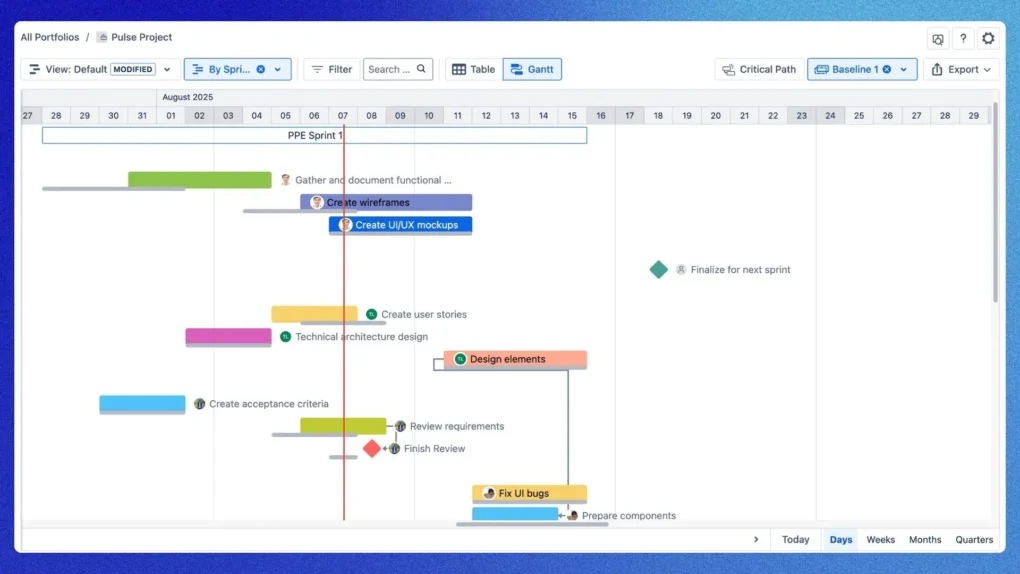
WBS Gantt Chart for Jira, developed by Ricksoft, has been around for years and is one of the most established Gantt solutions on the Atlassian Marketplace. As the name suggests, it offers both a work breakdown structure (WBS) and a classic Gantt timeline.
It’s full of traditional project management features: baselines, critical path analysis, resource management, exports to MS Project and Excel, and more. If you’ve ever used Microsoft Project, you’ll feel right at home.
GanttTable Pros: Lightweight, Modern, and Cost-Efficient
- Baseline and critical path support – Track your original schedule and highlight the tasks that determine overall project duration.
- Spreadsheet + Gantt view – Edit issues like you would in Excel while instantly seeing the impact on your timeline.
- Modern UI/UX – Clean, intuitive design that feels fresh and easy to use, even for those new to Gantt tools.
- Strong Jira integration – Uses Jira issues directly, so updates are always in sync.
- Quick onboarding – Ideal for teams that don’t want weeks of training or configuration.
- Currently free – A major plus for teams exploring Gantt solutions.
- Forge-based architecture & Runs on Atlassian badge — Because GanttTable is built on Atlassian’s Forge platform and qualifies for the “Runs on Atlassian” badge, users gain better trust, tighter integration, and assurance about data residency and security.
- Future Forge-based pricing – When it becomes paid, pricing will be based on actual users of the app, not your full Jira instance.
In short, GanttTable gives you the core Gantt experience without extra baggage, and its per-user pricing model (once introduced) will keep it accessible and budget-friendly.
WBS Gantt Chart for Jira Pros: Full-Featured, MS Project–Style Project Management
- Complete feature set – Baselines, critical path, dependencies, milestones, and advanced resource management.
- Work Breakdown Structure (WBS) – Organize projects into hierarchies for better clarity and reporting.
- Export/import options – Share schedules with clients or partners through Excel or MS Project.
- Familiar to project managers – The MS Project–like interface feels natural for anyone with a traditional PM background.
- Longstanding reputation – With years in the marketplace, it’s well-documented, well-reviewed, and backed by an experienced support team.
WBS Gantt Chart shines in environments where traditional project management discipline is required and where teams are already comfortable with structured, top-down planning.
GanttTable Cons: Smaller Ecosystem, Less Enterprise Maturity
- Smaller user base – Fewer public reviews and case studies compared to more established apps.
- Less enterprise depth – While it supports essentials, it may not go as deep into advanced project/portfolio management as WBS Gantt Chart.
WBS Gantt Chart for Jira Cons: Heavier, Older UI, Higher Cost
- Older user interface – Functional but less modern compared to newer Jira apps.
- Steep learning curve – Requires training for teams that don’t have a project management background.
- Performance concerns – Reported slowdowns with very large datasets, plus occasional bugs.
- Higher cost – Pricing is based on Jira instance size, which can be expensive if only a subset of users needs the tool.
GanttTable vs. WBS Gantt Chart for Jira: Features Comparison
| Feature | GanttTable | WBS Gantt Chart for Jira |
| Baseline & Critical Path | ✅ Yes | ✅ Yes |
| Dependencies & Milestones | ✅ Yes | ✅ Yes |
| WBS Hierarchy | ✅ Yes | ✅ Yes |
| Export/Import | ✅ CSV, XLSX | ✅ Excel, MS Project |
| UI/UX | ✅ Modern and clean | ❌ Older, less sleek |
| Ease of Use | ✅ Lightweight, quick onboarding | ❌ Steeper learning curve |
| Cost | ✅ Currently free; future Forge pricing by user | ❌ Higher; priced by full Jira instance |
Pricing and Licensing
Pricing is often one of the biggest deciding factors when choosing a Jira app. Here’s how the two compare:
GanttTable
GanttTable is currently free, but it will transition to a paid model starting in Q4 2025. The big difference is that it will use Atlassian’s new user-based pricing model under Forge.
That means you’ll only pay for the people who actually use the app—not your entire Jira instance.
- Example: If your company has 200 Jira users but only 10 need GanttTable, you only buy 10 licenses.
- At an estimated $4 per user/month, that’s just $40/month.
- Compared to traditional instance-based pricing, this approach can save teams a significant amount, especially when only a subset of users needs Gantt features.
This flexible pricing model makes GanttTable cost-efficient and easier to scale as your needs grow.
WBS Gantt Chart for Jira
WBS Gantt Chart follows the traditional Jira Marketplace pricing model, which is tied to the total number of users in your Jira instance.
- Example: With 200 Jira users, you’d pay for all 200—even if only a few of them use the app.
- That works out to around $210/month for 200 users.
For smaller teams, the difference might not be huge. But for medium and large organizations, the gap can grow quickly, with GanttTable offering a much leaner cost structure.
Which is Better?
The right choice depends on your team’s priorities.
Our Choice: GanttTable
For most modern Jira teams, GanttTable is the stronger option. It provides the features that matter most—baselines, critical paths, dependencies—while staying lightweight and easy to adopt. The Forge-based pricing model makes it even more attractive, as you’ll only pay for active users rather than your whole Jira instance. That means no wasted budget.
If you value a modern interface, cost efficiency, and speed of onboarding, GanttTable is the smarter pick.
Choose WBS Gantt Chart for Jira if:
- You’re a traditional project manager familiar with Microsoft Project.
- You require exports to Excel or MS Project for clients or compliance reporting.
- Your organization is willing to handle a steeper learning curve and higher price for a richer feature set.
Summary
Both GanttTable and WBS Gantt Chart bring structure to Jira projects—but they serve different types of teams.
- GanttTable is perfect for teams who want a modern, affordable, and efficient tool that makes planning simple and collaborative. With its current free status and future Forge-based per-user pricing, it’s designed to grow with you without blowing up your budget.
- WBS Gantt Chart for Jira is best for project managers who want traditional depth, advanced resource features, and tight alignment with Microsoft Project–style planning. It’s a more complex, more expensive tool—but also more feature-complete for enterprise PMOs.
👉 If your goal is simplicity and efficiency, go with GanttTable.
👉 If your goal is enterprise-level control and reporting, choose WBS Gantt Chart for Jira.
At the end of the day, both apps will give you a timeline and structure in Jira. The real decision comes down to how your team works, how much you want to spend, and how deep you need to go.