Agile teams love speed—faster releases, quicker sprints, shorter stand-ups—but moving fast doesn’t always fix a project in trouble. Sometimes teams crank out more tickets than ever, yet stakeholders still feel nothing meaningful is delivered. Metrics are meant to bridge that gap, but only if they reflect reality, not just numbers for show. Tracking everything creates noise; focusing on the right signals brings real clarity.
With modern ITSM tools, structured workflows and visibility make it easier to link Agile metrics to actual outcomes instead of just sprint stats. Metrics aren’t about controlling the team—they’re about awareness. When project managers understand patterns in delivery, they can adjust plans thoughtfully before making commitments.
What Are Agile Metrics
Agile metrics are practical measurements that show how work actually moves through a team. They go beyond counting completed tasks and help project managers understand workflow efficiency, product quality, and the value of reaching customers. Instead of focusing only on deadlines, they highlight how consistently and sustainably a team delivers.
Metrics such as velocity, sprint burndown charts, cycle time, lead time, and defect density each reveal a different part of the process. Together, they help identify bottlenecks, improve planning accuracy, and keep teams working at a realistic pace.
Why Agile Metrics Matter
Agile metrics matter because they replace assumptions with clarity. Without them, project managers rely on guesses about progress and timelines. With the right metrics, they can spot delays early, adjust priorities, and ensure meaningful work actually reaches users.
They also build trust. Stakeholders gain visibility into delivery, teams understand their strengths and gaps, and decisions become based on facts rather than pressure. When used wisely, Agile metrics guide improvement instead of turning into performance targets.
Agile Metrics Every Project Manager Should Track
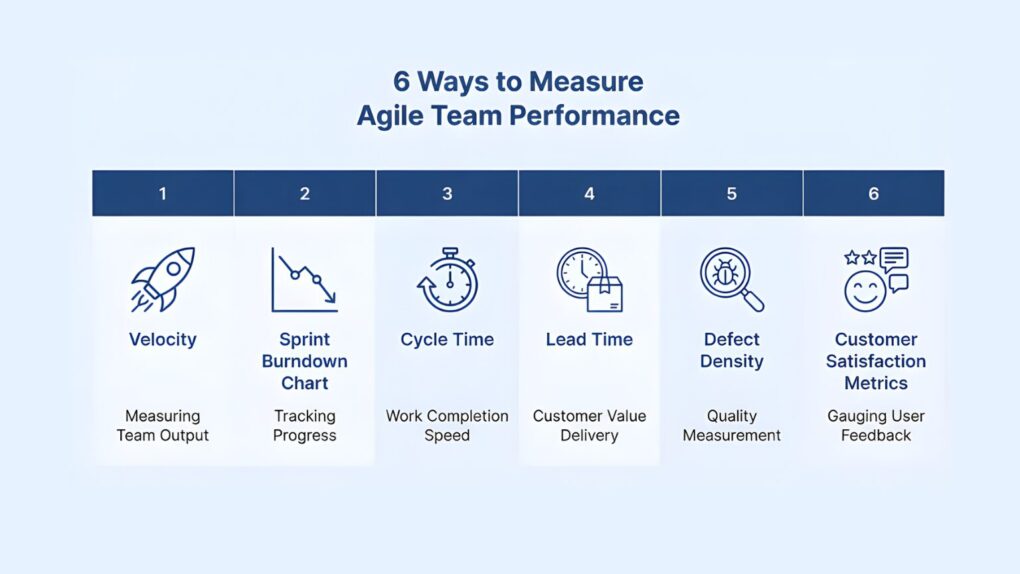
Velocity: Measuring Team Output
Velocity is often the first metric teams adopt, but it is commonly misused. The number itself is neutral, but pressure around it can cause burnout and quality drops. Treat velocity like a weather forecast, useful for planning direction, not as a target.
Some teams shift the focus from raw speed to sustainability, exploring practical delivery ideas. This changes how velocity feels: it stops being a competition and becomes a planning tool. Consistency beats growth, and a stable rhythm builds confidence, while sudden spikes usually hide unresolved issues
Sprint Burndown Chart: Tracking Progress
In Scrum, burndown charts are simple visuals that answer one key question: Are we actually moving forward? During stand-ups, they cut through long explanations, showing progress clearly without assigning blame.
Their value lies in visibility; teams stop guessing about progress and see it unfold day by day, whether smoothly or awkwardly. ITSM-driven dashboards can enhance this by connecting sprint visibility with incident tracking and service performance across teams.
Cycle Time: Work Completion Speed
Cycle time reveals where work actually gets stuck, often showing that tasks wait longer for approvals than for coding. Bottlenecks usually reflect workflow issues rather than technical skill.
This metric shifts focus from individuals to systems, helping teams understand why progress slows. Many teams integrate ITSM processes to streamline approvals, automate service requests, and reduce delays, aligning with best practices outlined in the PMI Agile Practice Guide.
Lead Time: Customer Value Delivery
Lead time connects internal processes to what customers actually experience. Customers don’t care how many sprints run; they care when value reaches them. Even if internal metrics like velocity and cycle time look healthy, features can remain stuck in backlog discussions, and lead time exposes this gap.
Shortening lead time requires sharper decisions, not longer hours. Teams need permission to prioritize what truly matters, and ITSM-aligned workflows can help bridge development and support, ensuring delivery timelines reflect real user needs.
This is also the reason why knowing how to calculate lead time using Jira is important.
Defect Density: Quality Measurement
Quality discussions get tense when bugs appear, which is why defect density works best as a signal, not a verdict. Fast Agile teams sometimes release too quickly and rely on patches later, which can erode trust over time.
Tracking defect density helps teams balance momentum with reliability. Small process tweaks—like clearer requirements, timely testing, and fewer last-minute changes- often reduce defects more effectively than heroic effort, and ITSM change management practices can reinforce this with structured review checkpoints without slowing delivery.
Customer Satisfaction Metrics
Internal metrics tell one story. Customer feedback tells another. The difference between those two stories often reveals where Agile needs adjustment.
A US Government Accountability Office report highlights how Agile practices improve collaboration and responsiveness across technology initiatives.
Feedback loops, retention data, and simple surveys help project managers understand whether releases truly resonate. Sometimes a single piece of honest feedback reshapes the entire backlog. That moment feels uncomfortable, but it keeps Agile grounded in reality.
Risk Awareness and Governance Metrics in Agile Projects
Agile discussions often focus on flexibility and experimentation, while governance and risk rarely get the same attention. Many teams only consider risk after disruptions occur, but modern digital environments leave little room for delay.
Key risk and governance metrics project managers should track include:
– Fraud exposure
– Compliance pressure
– External incidents
– Risk tracking alignment with delivery metrics
– Consumer protection & product liability oversight
– ITSM governance framework checkpoints
Coinbase lawsuit claims, along with high-profile cases like pig-butchering scams in the crypto industry, reveal legal scrutiny around scam-related incidents, showing how quickly external risks can spill into product ecosystems. They rarely start inside sprint boards, yet they end up reshaping priorities for engineering, support, and leadership alike.
Project managers must ensure risk awareness moves in sync with delivery metrics from day one. Law firms like TorHoerman advise focusing on consumer protection and product liability, while ITSM governance frameworks support this with structured risk tracking and compliance visibility across service lifecycles.
How Project Managers Can Use These Metrics Effectively
The most experienced project managers track fewer metrics than beginners expect. Not because they dislike data, but because they understand attention is limited.
Choose signals that spark discussion. Review them regularly, not obsessively. Let numbers guide decisions while leaving room for context and human judgment.
Sometimes, they ignore the dashboard for a moment. Walk into a sprint review. Listen to how the team talks about their work. Metrics reveal patterns, but conversations reveal meaning.
Conclusion
Agile metrics should never feel like surveillance. They exist to create awareness. Velocity shows rhythm, cycle time reveals friction, and lead time connects work to customers.
Governance metrics protect long-term stability. Project managers who treat metrics as conversation starters rather than performance scores build teams that adapt faster and deliver with intention.