Moving to Atlassian Isolated Cloud solves the security problem. It doesn’t change the work. Teams still need to update dozens of work items before a release, roll up estimates by epic, and answer “where are we?” in rows and columns. The catch: the spreadsheet app you relied on in Data Center may not be allowed into Isolated Cloud.
This article explains why, then shows you step by step how to build an advanced Jira spreadsheet, with hierarchy, formulas, and bulk editing, that stays inside the boundary.
Why spreadsheets are harder in Isolated Cloud
1. A quick look at Isolated Cloud
Isolated Cloud is Atlassian’s single-customer cloud. Instead of sharing infrastructure with other customers, your organization gets its own compute, storage, and networking inside a dedicated virtual private cloud.
Data egress is blocked by default, encryption keys are customer-managed, and Cloud Enterprise features plus Atlassian Guard Premium come included. If you want the longer version, our introduction to Atlassian Isolated Cloud covers it in more detail.
For this article, one thing matters most: the same walls that keep your data in also decide which apps get in.
2. Jira’s built-in table only goes so far
Jira’s List view is a perfectly decent table. You can see summaries, assignees, statuses, and a few more fields in one place. For a quick scan of a backlog, it does the job.
However, it starts to struggle when the questions get bigger. List view has no custom hierarchy, so you can’t line up initiatives, features, and stories the way your program actually runs. It has no sum-ups or formulas, so totals per epic mean a calculator and some patience.
On top of that, some of the usual reporting options aren’t there yet in Isolated Cloud. Atlassian Analytics isn’t available, and Rovo and Atlassian Intelligence features aren’t supported for now. So the spreadsheet view carries more of the reporting load than it would on standard cloud.
3. Most spreadsheet apps can’t come along
Isolated Cloud only runs apps built on Forge, Atlassian’s app platform where apps run on Atlassian’s own infrastructure. Customers can only install apps listed in the Isolated Cloud collection of the Marketplace.
That rules out a lot of familiar tools. Many established table and spreadsheet apps were built on the older Connect framework, or process data on the vendor’s own servers. On standard cloud, that’s normal. In an environment designed to keep data from leaving, it’s a deal-breaker.
There’s also no shortcut through migration. Data Center apps don’t carry over one-to-one to the cloud, so you’re picking a spreadsheet tool again anyway. Better to pick one that was built for where you’re going, not where you’ve been.
4. Exports count as egress too
The classic workaround for any Jira table problem is “just export it to Excel.” In Isolated Cloud, that habit needs a second look. Sending Jira data to Google Sheets, Smartsheet, or any outside service means the data crosses the boundary. App egress is switched off unless your organization explicitly approves it.
So the spreadsheet has to be genuinely useful inside Jira, not just a staging area before the real work happens somewhere else. What you need is a spreadsheet that runs entirely on Atlassian’s platform and is still strong enough to replace the tools your team had before.
How to build an advanced Jira spreadsheet for Isolated Cloud with GanttTable
GanttTable is a Forge-native app that combines an Excel-like Jira table with a Gantt chart and is available in the Isolated Cloud Marketplace collection. We’ll stay on the table side for almost the whole walkthrough.
Before you start, check three things. You’ll need a Jira admin to install the app. You should know which projects and work types the sheet will cover. And it helps to pick one real use for the first sheet, like a single release, rather than trying to boil the ocean on day one.
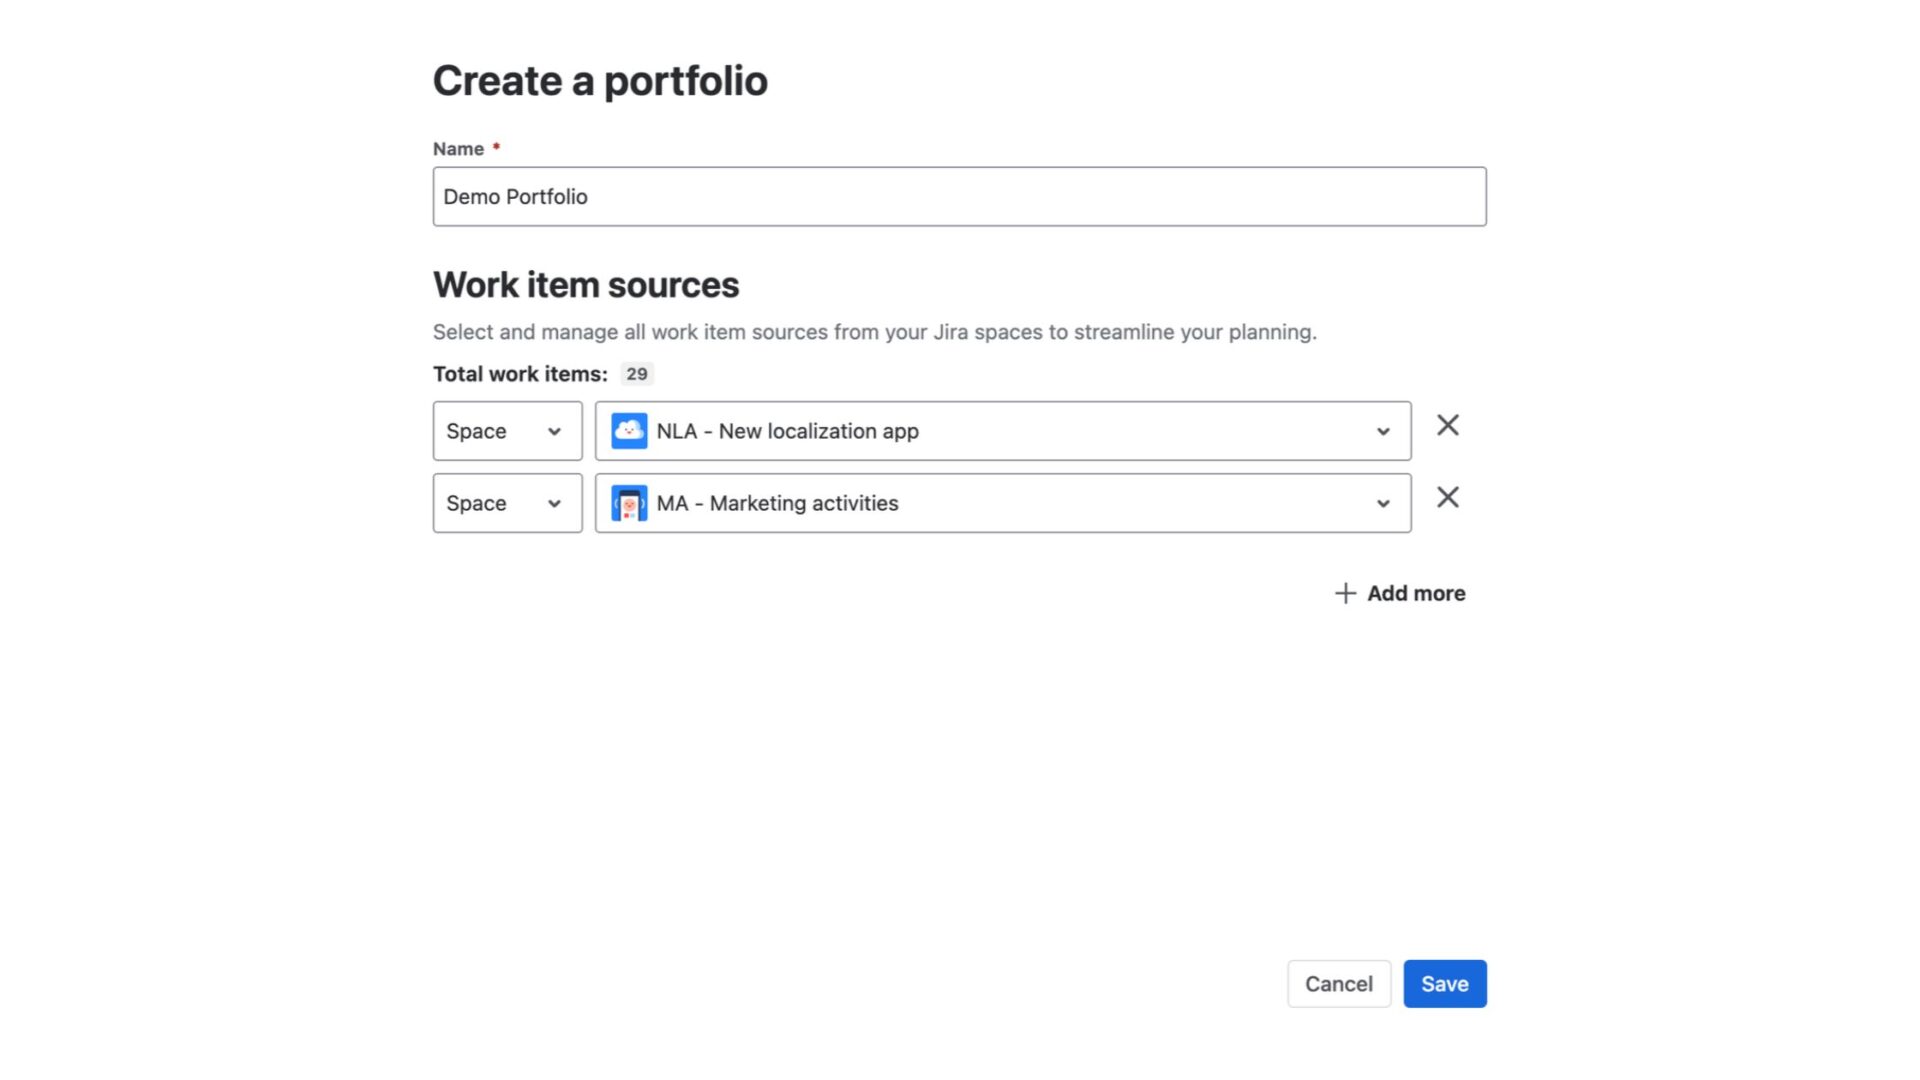
Step 1: Create a table and set its scope
The first thing you need to do is to create a new table and decide which work items it should pull in. You can scope it to one or multiple projects, or narrow it down with a filter or JQL, for example, everything in a specific fix version.
Step 2: Choose a hierarchy structure
This is where the table stops being a list and starts being a plan. You have two options:
- Built-in Jira hierarchy: epics, their child work items and sub-tasks, nested the way Jira already understands them.
- Custom structure: build your own levels from work item links, such as initiative, then feature, then story. Useful when your program’s shape doesn’t match Jira’s default.
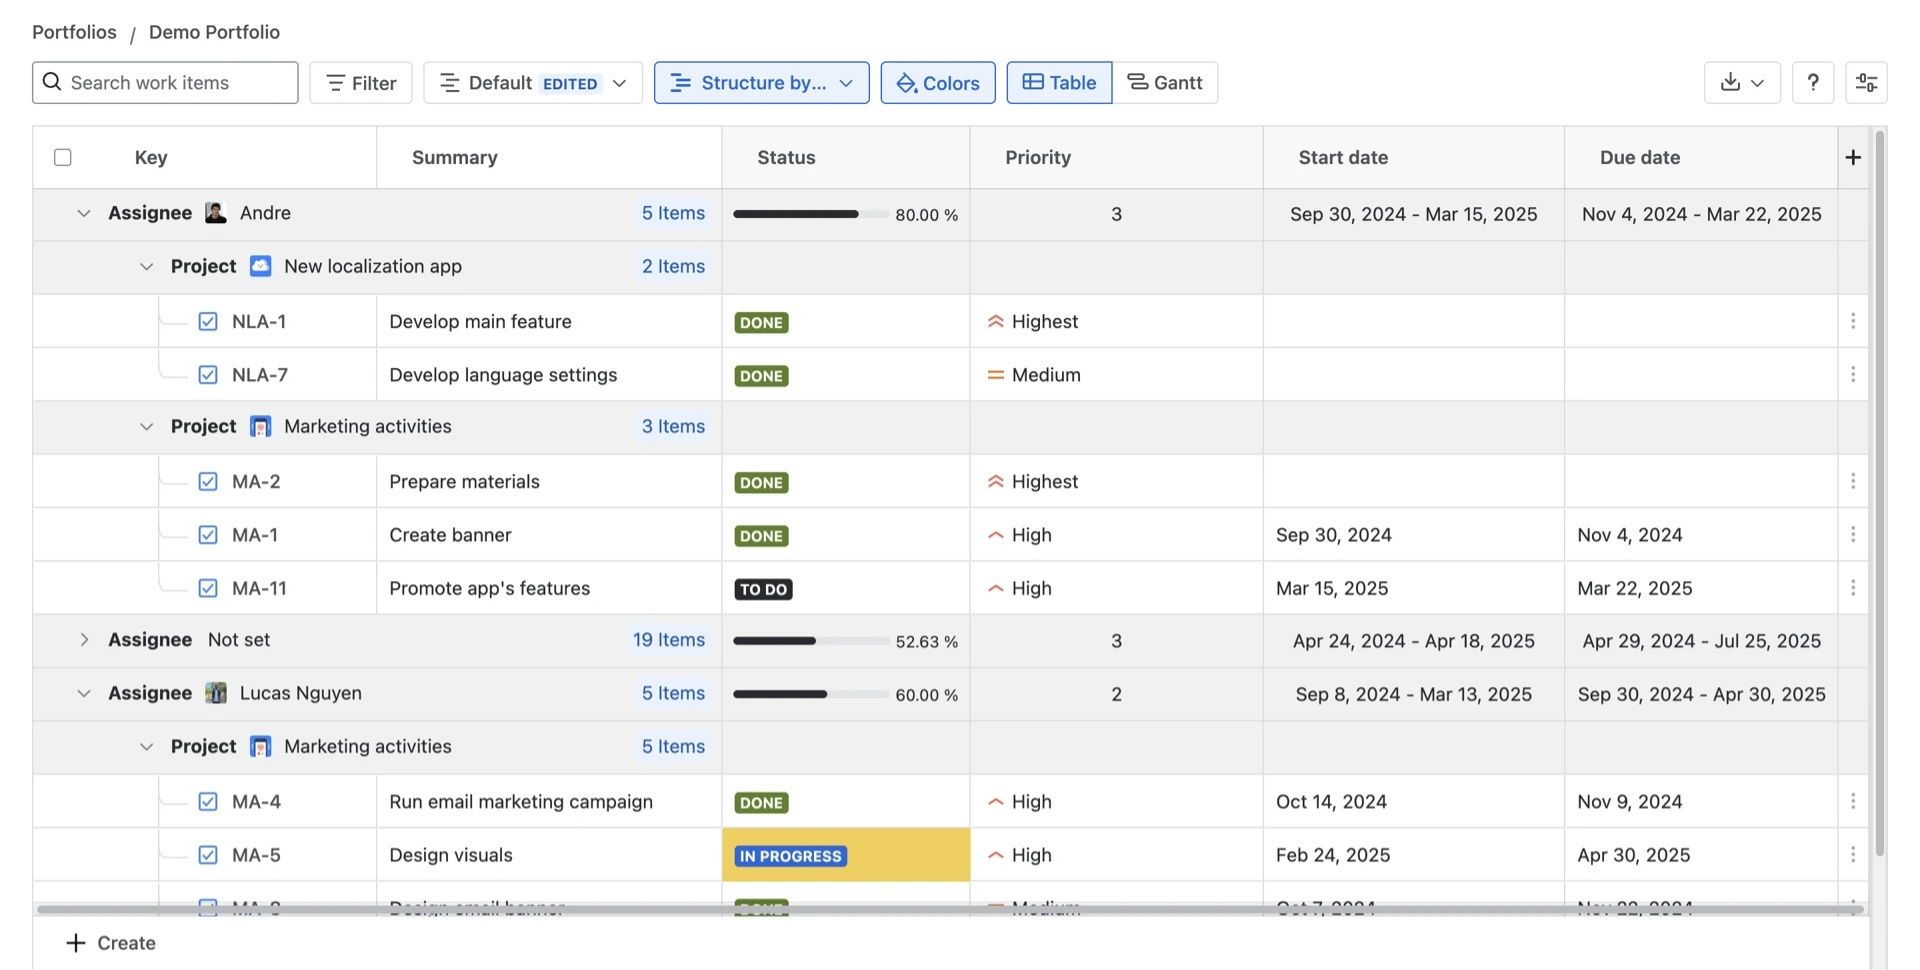
Why it matters: hierarchy is the foundation for everything that follows. Without it, there’s nothing to roll up.
To build a hierarchical structure, you can create a new group and choose different Jira fields for each level you want to show in the advanced Jira spreadsheet.
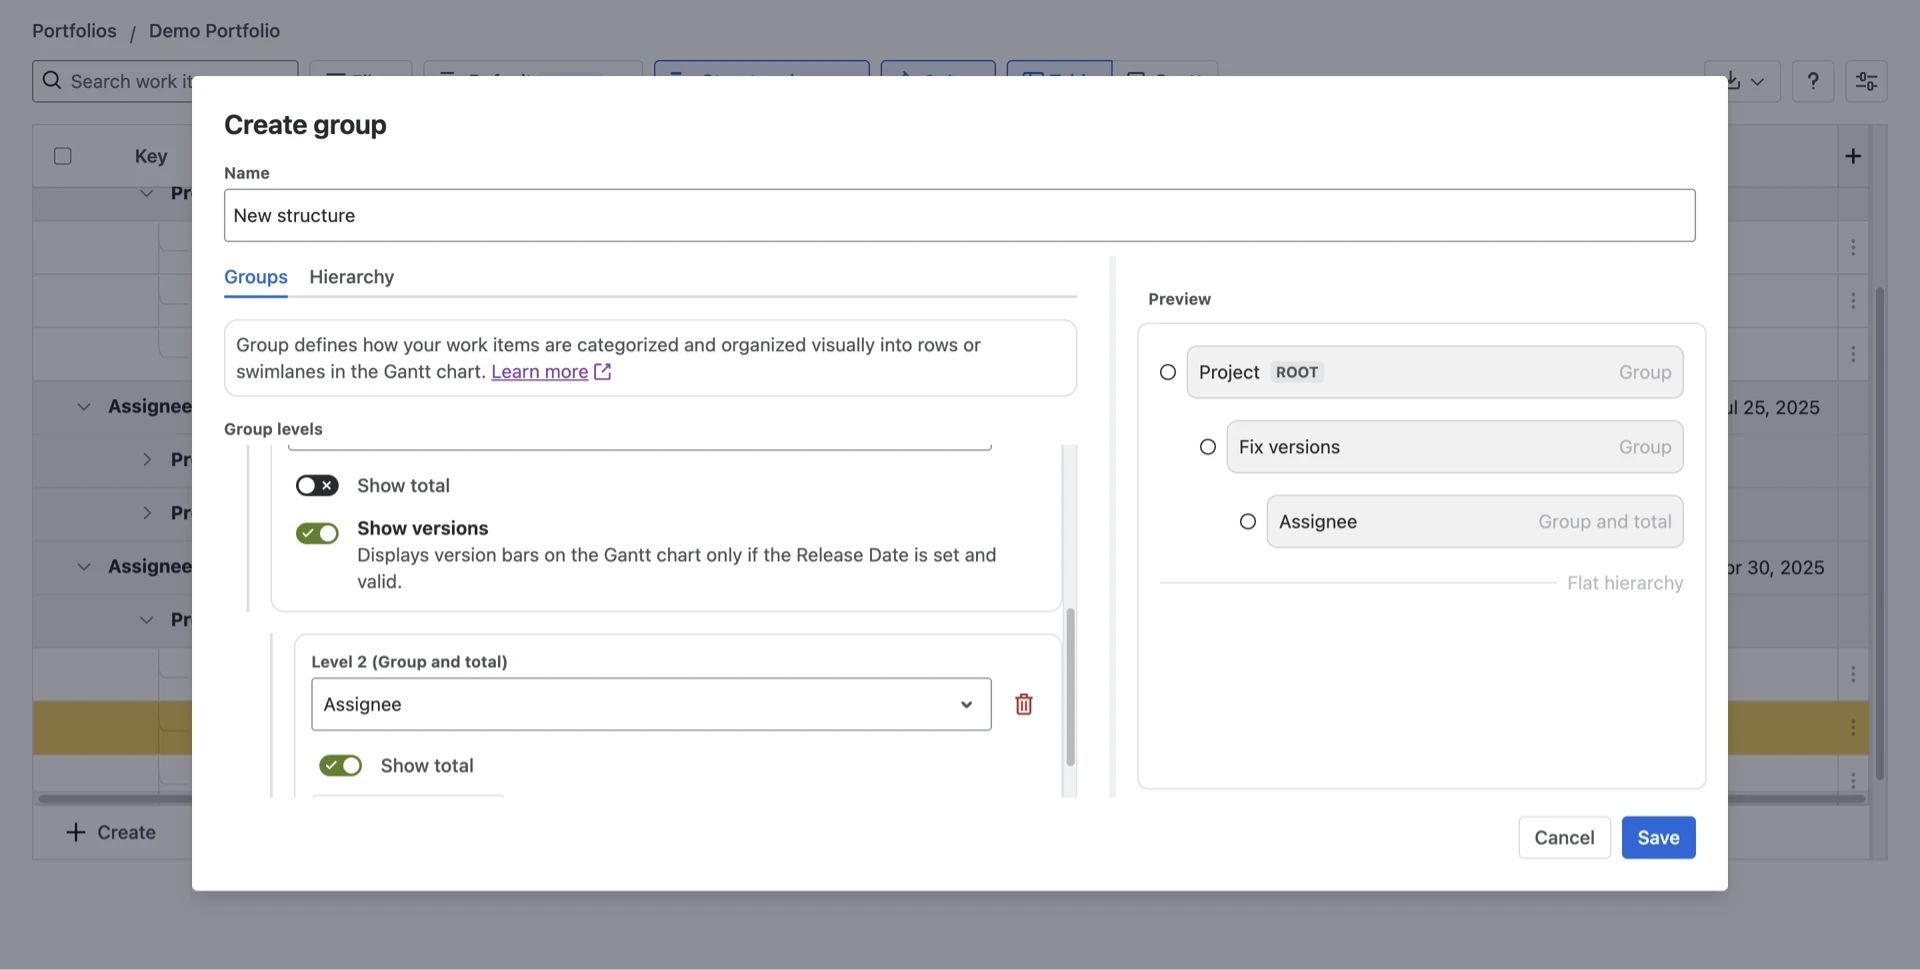
Step 3: Add and arrange columns
You can add the Jira fields you and your team care about, both system fields and custom fields. Then arrange them so the sheet reads naturally: identifiers on the left, the fields people edit most in the middle, and the numbers you’ll total on the right.
However, remember to keep it lean. A sheet with 30 columns is a sheet nobody is willing to scroll to the end of.
Step 4: Add calculations
Now for the part that turns a table into a spreadsheet:
- Smart columns show values calculated or derived from Jira fields, with several prebuilt types to choose from.
- Custom formulas let you write Excel-style formulas for your own calculations.
- Time in status columns show how long work has been sitting in each status.
- Group, Total, or Group and total roll values up the hierarchy you set in Step 3.
A good first example: sum story points and remaining estimates for each epic. It’s the question managers ask most, and now the answer updates itself.
Step 5: Edit at scale
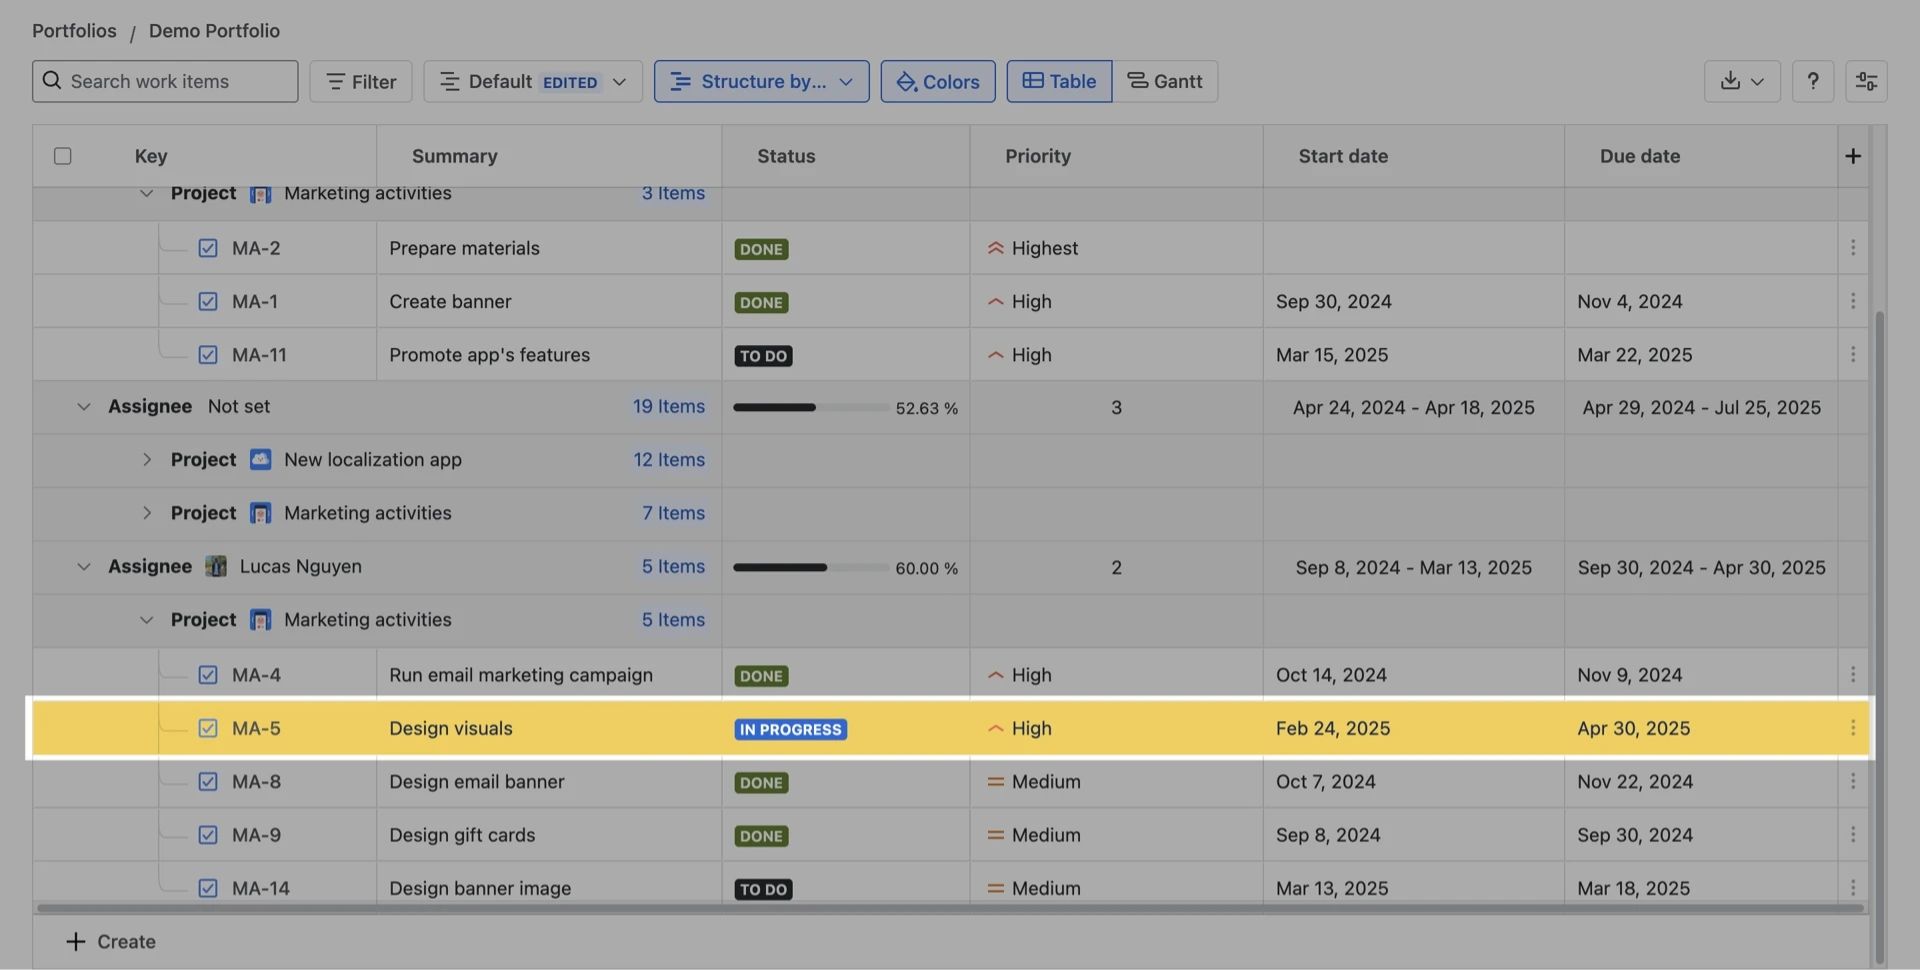
This is where you’ll save the most time week to week. Edit cells inline, the same way you would in a spreadsheet. Copy and paste values across work items.
Additionally, you can select multiple rows and apply bulk actions. Use colour marks to flag cells or rows that need a second look.
All of these edits are real Jira edits. There’s no import step and no “did someone update the master copy?” conversation.
Step 6: Save the view and share it with the team
Once the structure, columns, and calculations look right, save the setup as a named view. You can also set a default view, so everyone on the team opens the same sheet the same way.
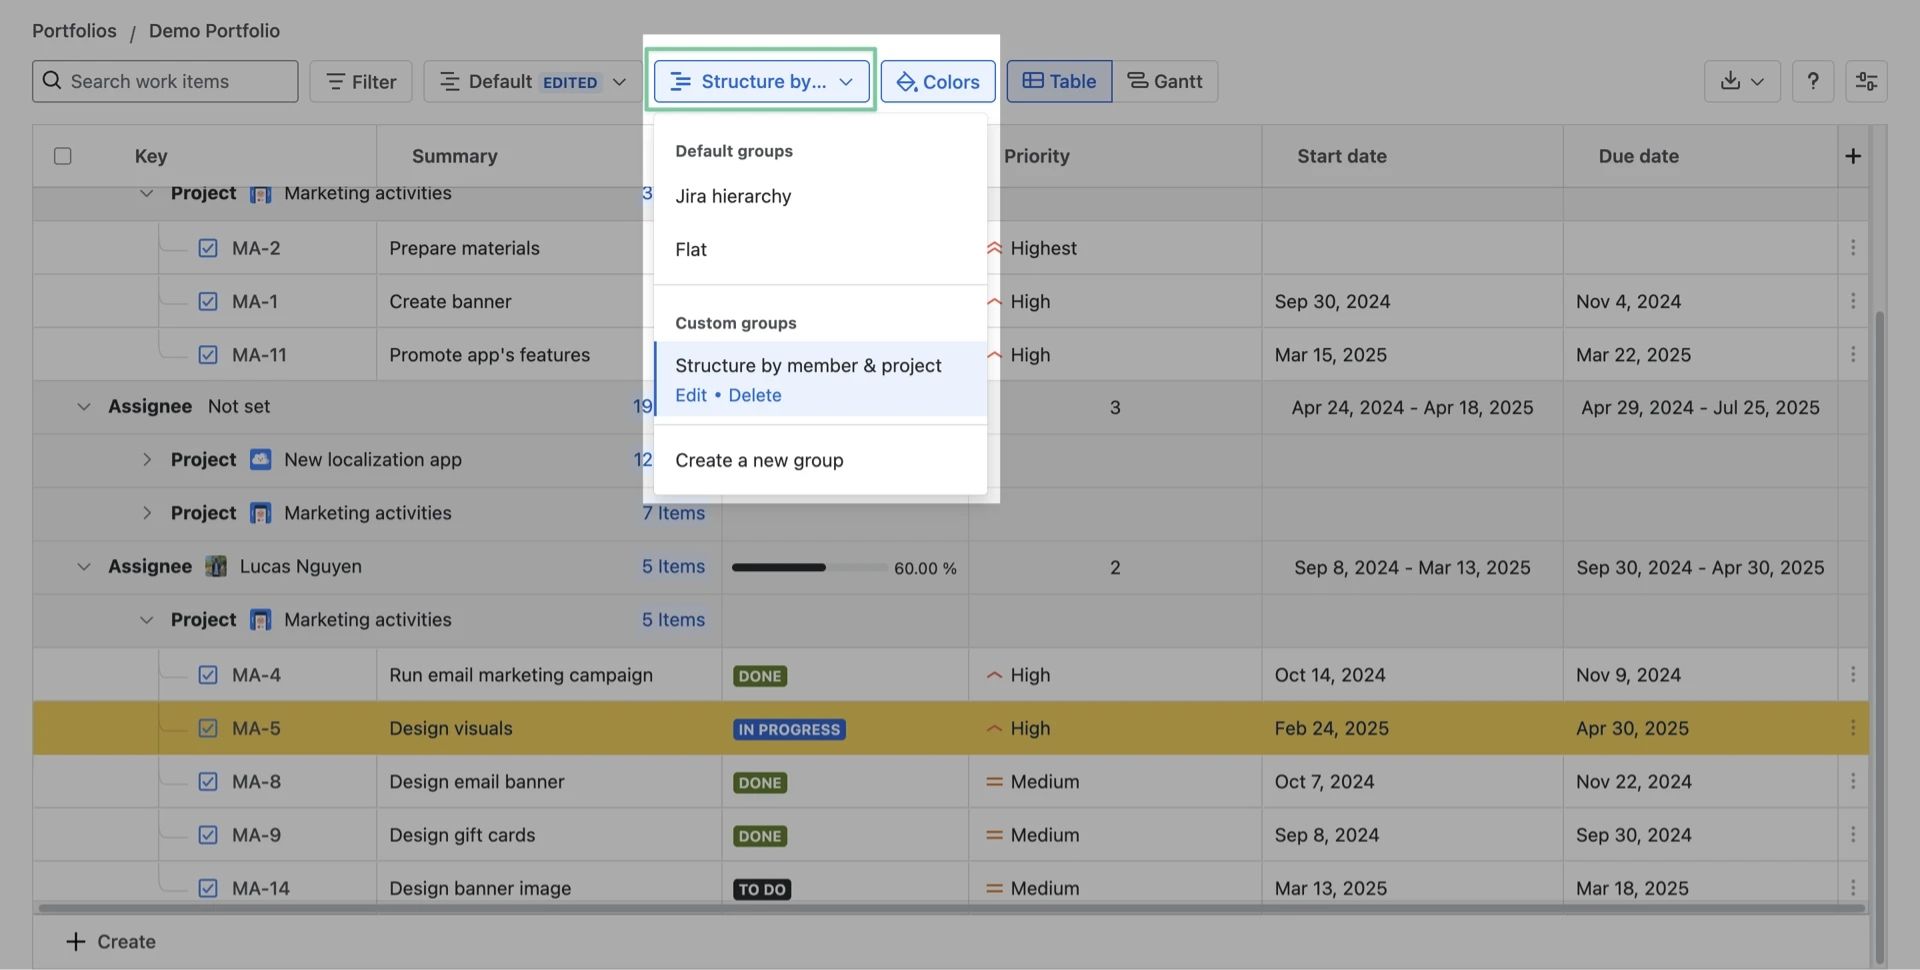
It’s a small step that ends a lot of “which version are you looking at?” confusion.
Step 7 (optional): Switch to the Gantt side
If your sheet includes dates, the same data can be shown on a Gantt chart, with dependencies, milestones, and the critical path. You don’t need it to get value from the spreadsheet, but it’s handy when the next question is “so when will this be done?”
What makes GanttTable capable
A Jira spreadsheet app for Isolated Cloud has to pass two separate tests. Is it allowed in? And once it’s in, is it good enough that people actually use it? Plenty of apps pass one and fail the other.
1. Built for the boundary
GanttTable was built on Forge from day one, so there was no older version to retrofit or quietly keep alive in the background. It carries Atlassian’s Runs on Atlassian badge, which means:
- Compute and storage run on Atlassian’s own infrastructure, not a vendor’s servers.
- Data residency matches the host Jira site.
- Data egress stays under the customer’s control.
In practice, your tables, saved views, formulas, and structure definitions are all stored on the Atlassian platform, next to the Jira data they describe. GanttTable is also available on Atlassian Government Cloud, which is authorized at FedRAMP Moderate.
That’s a fairly convincing sign the architecture holds up in strict environments, rather than just a claim on a feature page.
2. Spreadsheet depth that replaces Data Center tools
Passing the security review is only half the job. A compliant tool nobody wants to use is just an expensive line item. GanttTable covers the things teams usually relied on a Data Center spreadsheet app for:
- Custom hierarchies, plus grouping and totals at every level.
- Smart columns and custom formulas for calculated values.
- Inline editing, copy and paste, bulk actions and colour marks.
- Saved views and a team default view.
- Tables that span several Jira projects in one place.
3. Table and timeline in one app
Many teams that need a spreadsheet also need a timeline sooner or later. With GanttTable, both live in the same app and work on the same data.
That matters more in Isolated Cloud than elsewhere. Every new app means another security questionnaire, another architecture review, and another round with legal, so one fewer app to approve is worth a lot.
Example use cases
Here’s how the steps above come together in three situations most teams will recognize.
Release readiness across multiple projects
A release touches the web, API, and mobile projects, and the release manager wants one honest answer to “are we ready?”
- Setup: a table scoped to the release’s fix version across all three projects, grouped by project, with status and remaining estimate columns and totals per group.
- Result: one view of what’s left, which team it belongs to, and how much work remains. No exporting, no stitching three reports together on a Friday afternoon.
Backlog refinement and bulk updates
Refinement sessions have a habit of turning into a long tour of the work item view, one click at a time.
- Setup: a table built from the backlog filter, with priority, story points, sprint, and component columns.
- Result: the team re-prioritizes and re-estimates dozens of items in one sitting, using inline edits, copy and paste, and bulk actions. The meeting ends on time, which may be the most impressive part.
Effort and cost roll-ups for a PMO
A PMO needs numbers at the initiative level, and Atlassian Analytics isn’t available in Isolated Cloud to build them.
- Setup: a custom hierarchy from initiative to feature to story, formula columns for effort or cost, and Group and total by initiative.
- Result: management-ready numbers that live inside Jira and update as the work changes. It won’t replace a full analytics platform, but it covers the questions that come up every week.
One more idea if you have the time: add time-in-status columns to spot work stuck in review before an audit or release gate. It’s a quick way to find out which items have been “almost done” for three weeks.
Conclusion
Isolated Cloud takes care of the infrastructure. Your team still needs a proper spreadsheet layer on top of Jira, and the right one has to pass two tests: it’s allowed inside the boundary, and it’s capable enough to replace what you had before.
A Forge-native spreadsheet like GanttTable passes both. If your migration is planned before Data Center’s end of life in 2029, choose your Jira spreadsheet tool with Isolated Cloud’s rules in mind from the start. It beats finding out in week one that your favorite app missed the boat.
FAQ
Can I use a Jira spreadsheet app in Atlassian Isolated Cloud?
Yes, as long as the app is built on Forge and listed in the Isolated Cloud collection of the Atlassian Marketplace. Apps outside that collection can’t be installed.
GanttTable is available there and gives you an Excel-like Jira table with hierarchy, formulas, and bulk editing.
Why isn’t Jira’s List view enough?
List view is fine for scanning work items, but it has no custom hierarchy, no sum-ups, and no formulas. You also can’t save a structured view that the whole team opens the same way. For release tracking, refinement, or roll-ups, you’ll outgrow it quickly.
Does GanttTable send Jira data outside Isolated Cloud?
No. GanttTable runs on Atlassian’s platform under the Runs on Atlassian standard, and its tables, views, and formulas are stored there. Data egress stays under your organization’s control, in line with how Isolated Cloud is designed to work.
Can I export a Jira spreadsheet in Isolated Cloud?
Exports to outside services, such as Google Sheets or Smartsheet, send data across the Isolated Cloud boundary. They’re likely to be unavailable or to need admin approval first. Check with your Jira admin before relying on any export as part of a regular workflow.
Can one spreadsheet cover several Jira projects?
Yes. Scope the table to several projects, or use a filter or JQL that spans them. Then group by project to see each team’s work and totals side by side in one sheet.