
It is easy to overlook when planning capacity for a single team. However, the moment work spreads across several teams, each on its own board with its own velocity, that intuition breaks down.
As a result, teams get over-committed while their neighbors sit idle, and shared people get booked past 100% because no single board sees their whole week. Besides, dependencies might surface too late to resequence around, and releases slip because nobody has a combined picture of who could do what, and by when.
This guide walks through a repeatable method for cross-team capacity planning in Jira: what “capacity” should mean when teams aren’t comparable, how to build a baseline you can trust, how to normalize different teams into one picture, and how to turn a fragile single-date commitment into a forecast you can defend.
Why native Jira makes cross-team capacity planning hard
Before fixing the problem, we need to know exactly where Jira leaves you on your own. While its planning tools are excellent for a single team, they are usually silent about everything else above that level.
1. Boards and sprint reports are single-team by design
A board reflects one team’s work, and the velocity and sprint reports are scoped to that board. There’s no native “sum across boards” view that rolls several teams into one combined capacity number.
If you want the total, you’re exporting figures and stitching them together yourself, usually in a spreadsheet that’s out of date the day after you build it.
2. Shared people get double-counted across boards
In scaled setups, specialists get spread thin: one QA engineer supporting two squads, an architect reviewing for three, a designer floating between products.
On each board, that person looks fully available. Add the boards together naively, and you’ve counted the same human two or three times. Your combined capacity number is inflated before you’ve committed a single item.
3. Cross-team dependencies stay invisible in per-board planning
When you plan one board at a time, you see that team’s work in isolation. What you don’t see is that team B can’t start its piece until team A ships an API, or that team C is waiting on both.
Per-board planning hides the sequence, so the blocking relationships only reveal themselves mid-quarter, right when they’re most expensive to fix.
4. Native Jira has no real view of availability
This is the elephant in the room, and it’s where capacity actually leaks. Jira knows about issues and story points, but it doesn’t know if two people are on holiday next sprint, that someone’s part-time, or that a support rotation eats a day a week from one team.
All of that reduces real capacity, none of it shows up on the board, and most over-commitment traces back to planning as if everyone is available 100% of the time when they never are.
None of this means Jira is the wrong tool. It’s just that the multi-team layer is something you have to build on top of it deliberately.
How to plan capacity across multiple teams and boards
Step 1: Define what “capacity” means for your context
“Capacity” can mean two different things across teams, and picking one is half the battle.
Time-based capacity counts available working time: person-days left after PTO, holidays, meetings, and support rotations. Throughput-based capacity counts how many issues a team actually completes per period, ignoring estimates entirely.
However, whether to use time-based capacity for mixed or scaled setups where real availability is the question. You can use throughput when estimates are unreliable, which is common once several teams are involved.
If you go time-based, availability has to be real rather than assumed, and a capacity planning tool like TimePlanner models each person’s actual availability in Jira. As a result, the capacity percentage reflects who is genuinely free, not a theoretical headcount.
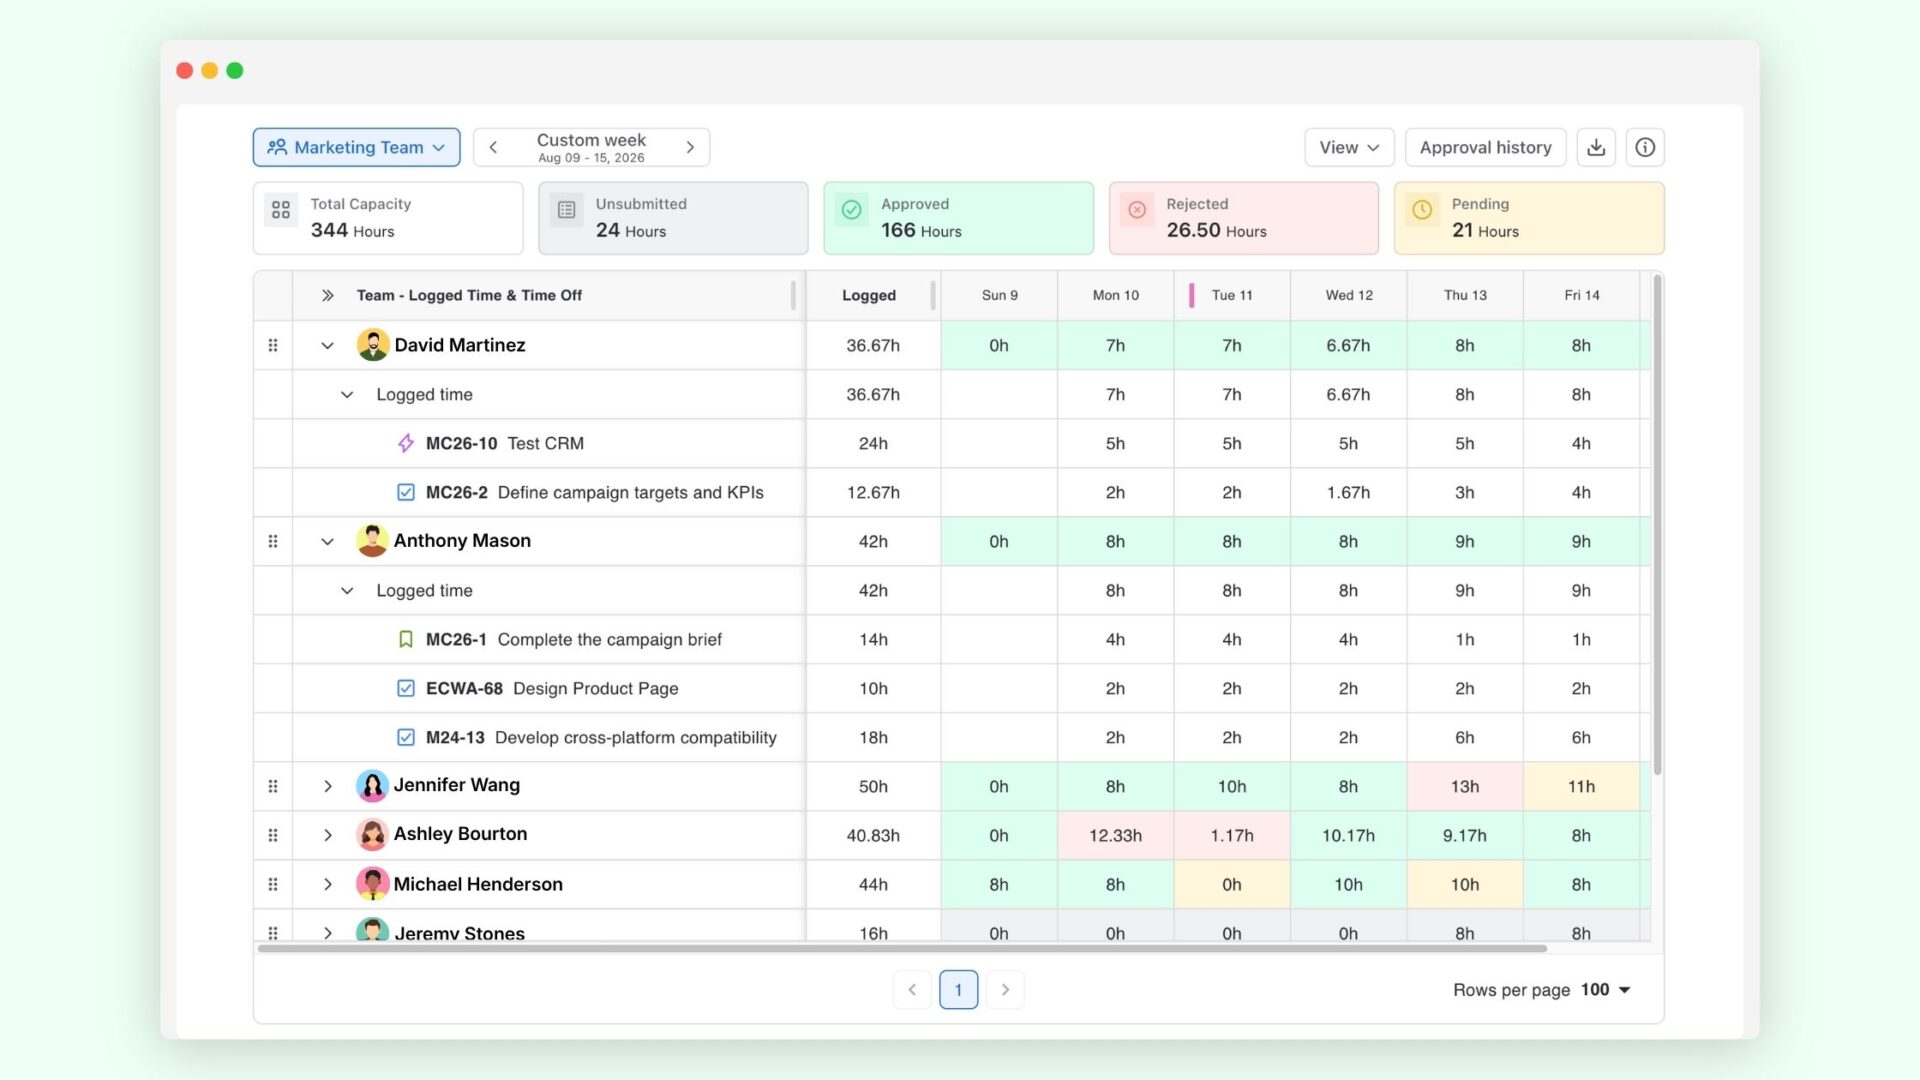
Either way, don’t use raw story points as the cross-team unit. Since each team calibrates them differently, adding them up produces a number that looks precise but means nothing.
You can pick one common currency, time or throughput, and convert every team into it. Everything downstream depends on this choice.
Step 2: Establish a reliable baseline per team
Once you know your unit, build a baseline for each team from its own history rather than its aspirations.
Firstly, you can try to pull a consistent window of history. Use the same lookback for every team (say, the last six to ten sprints) so no baseline is flattered by a cherry-picked run.
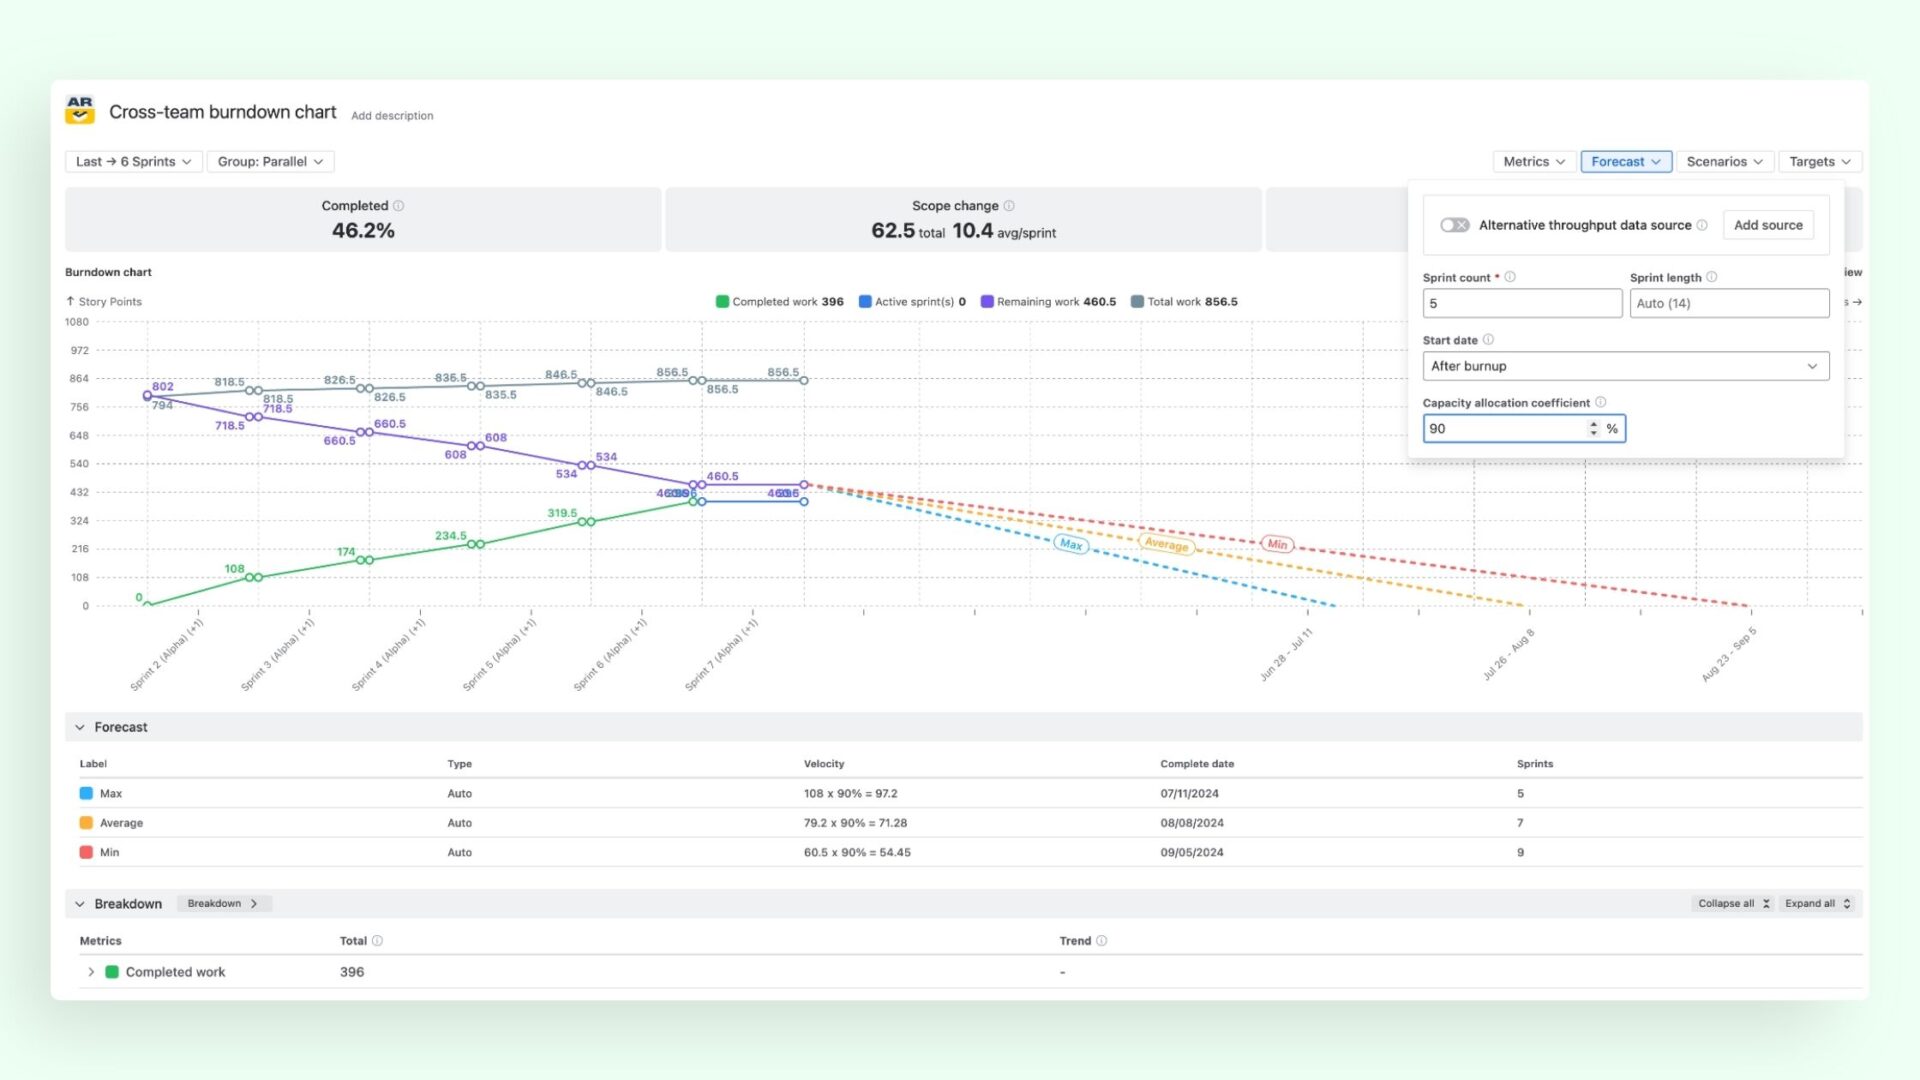
Native Jira scopes these reports to a single board, so doing it at scale usually means manual exports. Meanwhile, Broken Build’s Agile Burnup Burndown Charts read Jira history across any scope (Scrum and Kanban boards, projects, releases, epics, initiatives, or JQL) and in whatever unit the team plans in, which makes pulling comparable baselines far less of a spreadsheet exercise.
It is also recommended to use a range, not a single number. A team that closes 18 to 30 issues a sprint doesn’t have a capacity of “24.” A low-to-high band keeps the plan honest and sets up the forecasting in Step 5.
And don’t forget to subtract upcoming leave and holidays, and account for anything that will reduce output, like a new hire ramping up or a team losing a member.
Additionally, you can allocate shared people instead of double-booking them since they are the most common source of inflated multi-team plans. All you need is to decide up front how each cross-team person’s time splits (60/40, or whatever it really is) and bake it into each baseline.
You can use TimePlanner’s schedule board to make this visible across teams by showing who is available, overloaded, or underutilized in one place. Besides, Broken Build’s Burnup Burndown Charts app can reflect partial dedication directly in the forecast: a capacity allocation coefficient multiplies the team’s historical velocity by the share of capacity assigned to this scope, so a half-committed team never reads as fully available.
Step 3: Normalize across teams so numbers are comparable
Your baselines may still not be comparable. Normalizing gets every team into the same unit and time frame so you can roll capacity up across boards.
What you need to do is to convert every team to one common unit and express all teams in whichever currency you chose in Step 1. Next, bring a one-week Kanban team and two-week Scrum teams onto a shared horizon (a rolling four-week window, a quarter, or a PI) and scale each team’s figures to it.
Once both cover the same span of calendar time, their numbers compare cleanly.
Another thing to do is roll capacity up into one combined view. You should aggregate every team into a single view showing each team’s range and the combined total.
This cross-board rollup is what native Jira never gives you. On the reporting side, Broken Build‘s Burnup Burndown Charts app aggregates multiple sources, including several Scrum or Kanban boards, projects, epics, initiatives, or SAFe hierarchies, into one chart at the program or ART level.
These are two halves of the same question. Agile Burnup Burndown Charts show how much work has actually been delivered within the selected scope and forecast what can realistically be delivered next; that’s the Broken Build side. Capacity tells you how much of each team is genuinely available to deliver it, and that’s where TimePlanner does the heavy lifting.
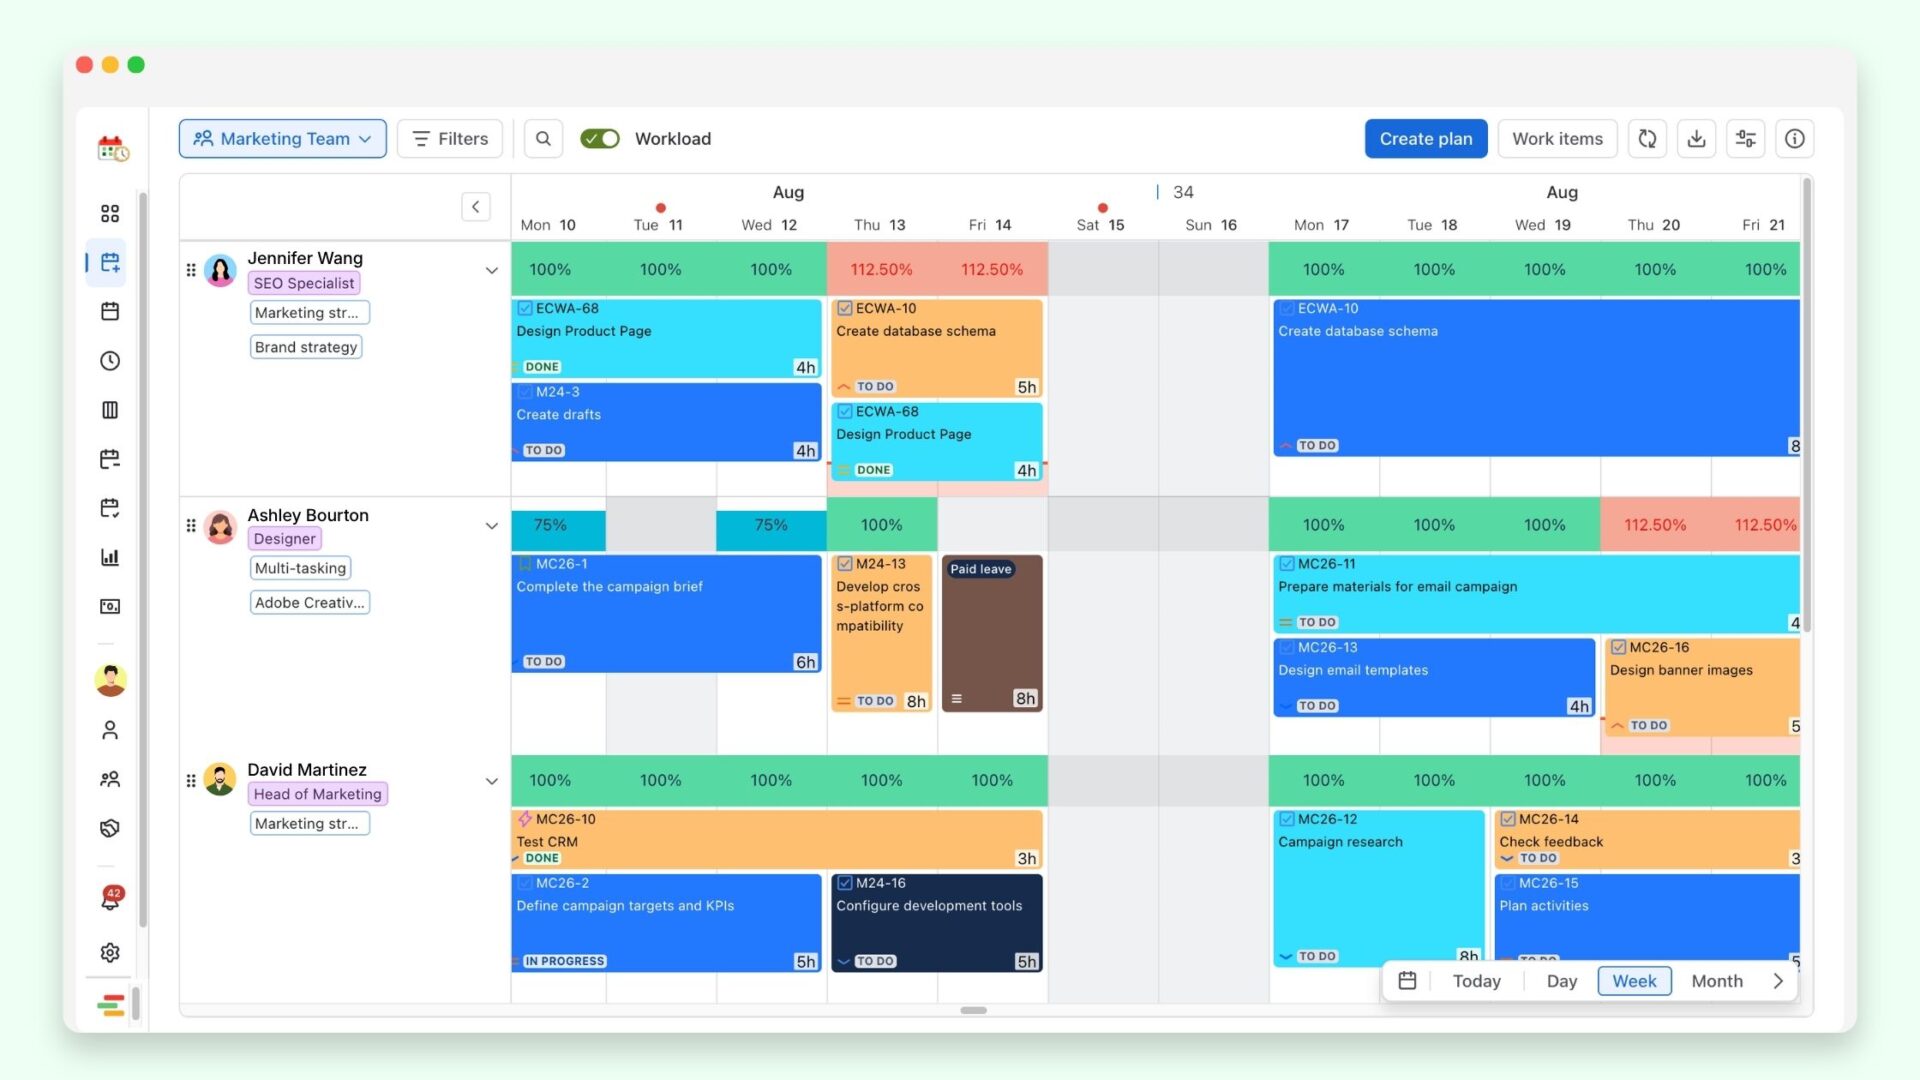
Its schedule board gives one live, cross-team picture of capacity and workload spanning boards that has already been adjusted for leave requests and holidays. So, you can see the combined availability of every team without stitching exports together.
Step 4: Map demand against combined capacity
Capacity is only half the equation. What you should do is break work down to the teams each item needs.
For every epic, identify which teams it touches and how much of each it will consume. A “single” feature often needs backend, frontend, and QA across three boards, so make that explicit.
Additionally, you can overlay demand on capacity to spot imbalances early. In the same unit, mismatches jump out: one team at 130% while another sits at 70%.
Catching this before the quarter starts is the whole point. TimePlanner surfaces exactly this across teams, flagging who is overloaded and who is underutilized. Besides, its drag-and-drop schedule board lets you rebalance the load rather than reworking the whole spreadsheet.
When something doesn’t fit (and it usually doesn’t on the first pass), your levers are clear: move scope, shift a shared person to the team that has room, or trim the commitment to what the numbers support.
Step 5: Forecast confidence, not just a point number
Stop pretending you can predict delivery to the day. A single “we can do X” number is fragile, and across teams it’s more fragile, not less. Variability compounds: the odds that every team hits its optimistic number at once are far lower than for any one team alone.
That’s why confident single-date commitments across teams slip so reliably.
Instead, let’s think in ranges. Rather than “the release lands March 14th,” aim for “an 85% chance by March 21st, a 50% chance by March 14th.” Monte Carlo forecasting gets you there by simulating many outcomes against each team’s history and variability.
And you don’t have to build it yourself. Broken Build‘s Burnup Burndown Charts app forecasts across boards with Min/Average/Max scenarios and Monte Carlo simulations, and its alternative throughput option can base a team’s forecast on another board’s history when its own data is irregular.
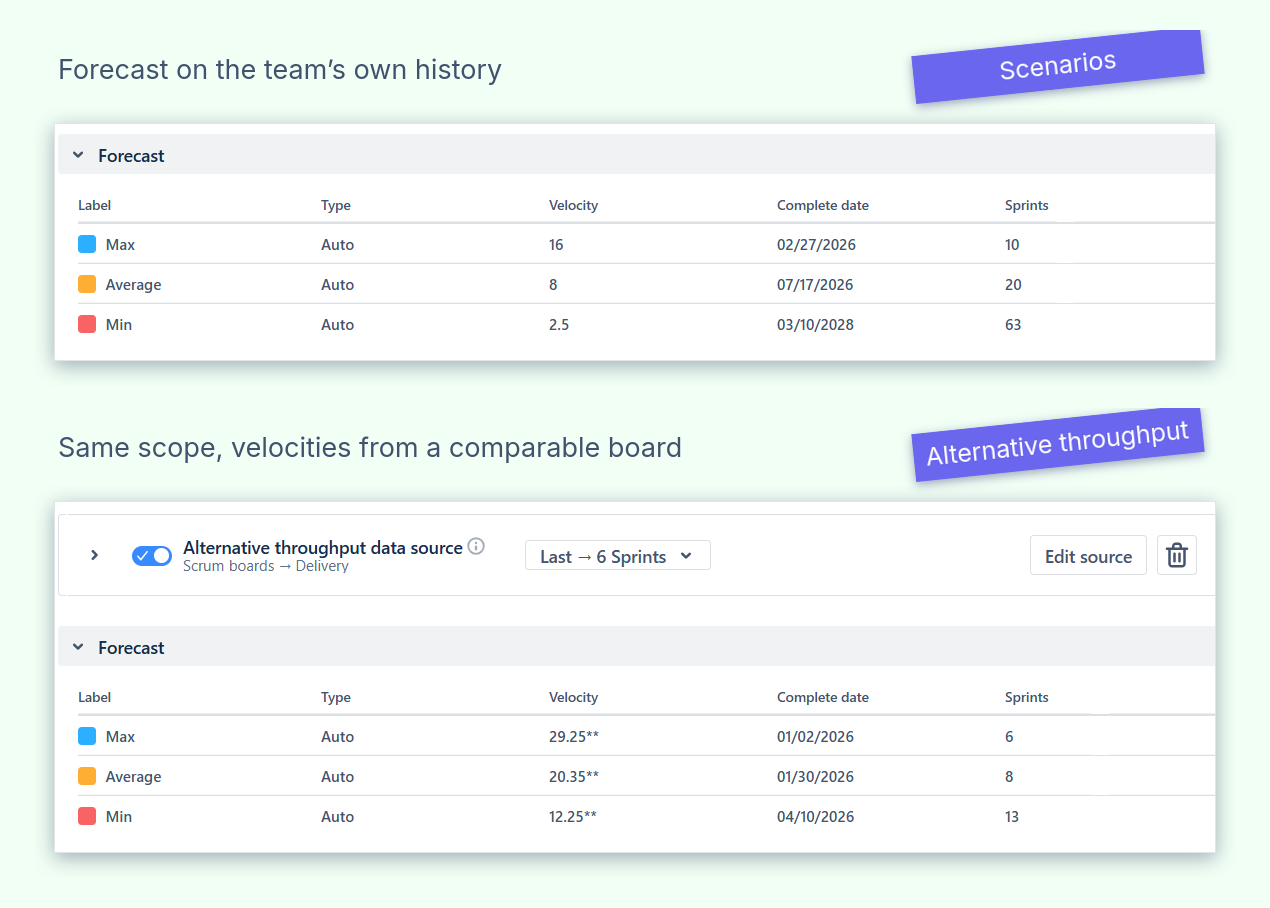
Either way, a confidence range is something stakeholders can plan around, because it names the risk instead of hiding it.
Tips for effective cross-team capacity planning in Jira
A few habits separate plans that hold up from plans that unravel by mid-quarter.
1. Don’t plan to 100% utilization
A team booked to the last available hour has no room for the interrupts, production bugs, and support work that never appear as planned issues but always consume real capacity. Leave deliberate slack, a meaningful buffer rather than a token one, so the first unexpected thing doesn’t derail the whole plan.
2. Standardize how leave, holidays, and non-project time get recorded
If one team logs holidays meticulously and another doesn’t bother, their “available” numbers aren’t comparable, and your combined view is built on sand. Agree on one way to capture time off, public holidays, rotations, and other non-project time, and apply it everywhere so a person-day means the same thing on every board.
3. Make cross-team dependencies visible early
Dependencies are cheapest to handle before the quarter starts. Therefore, you should surface them during planning, order the work so upstream teams deliver what downstream teams need in time, and keep that sequence visible as things move; a blocked team is wasted capacity you already paid for.
4. Compare planned vs. actual each cycle
Cross-team estimates only become trustworthy through iteration. At the end of each cycle, look at where the plan and reality diverged, figure out why, and let that sharpen the next baseline.
This is also the step native Jira can’t support: its velocity report shows initial commitment, completed work, and an average line – nothing that explains a miss. Broken Build’s Agile Velocity Charts lets you pick the metrics that do: rollover, total scope change, and completed work (initial) vs. completed work, in absolute numbers or as a say-do percentage that stays comparable across teams.
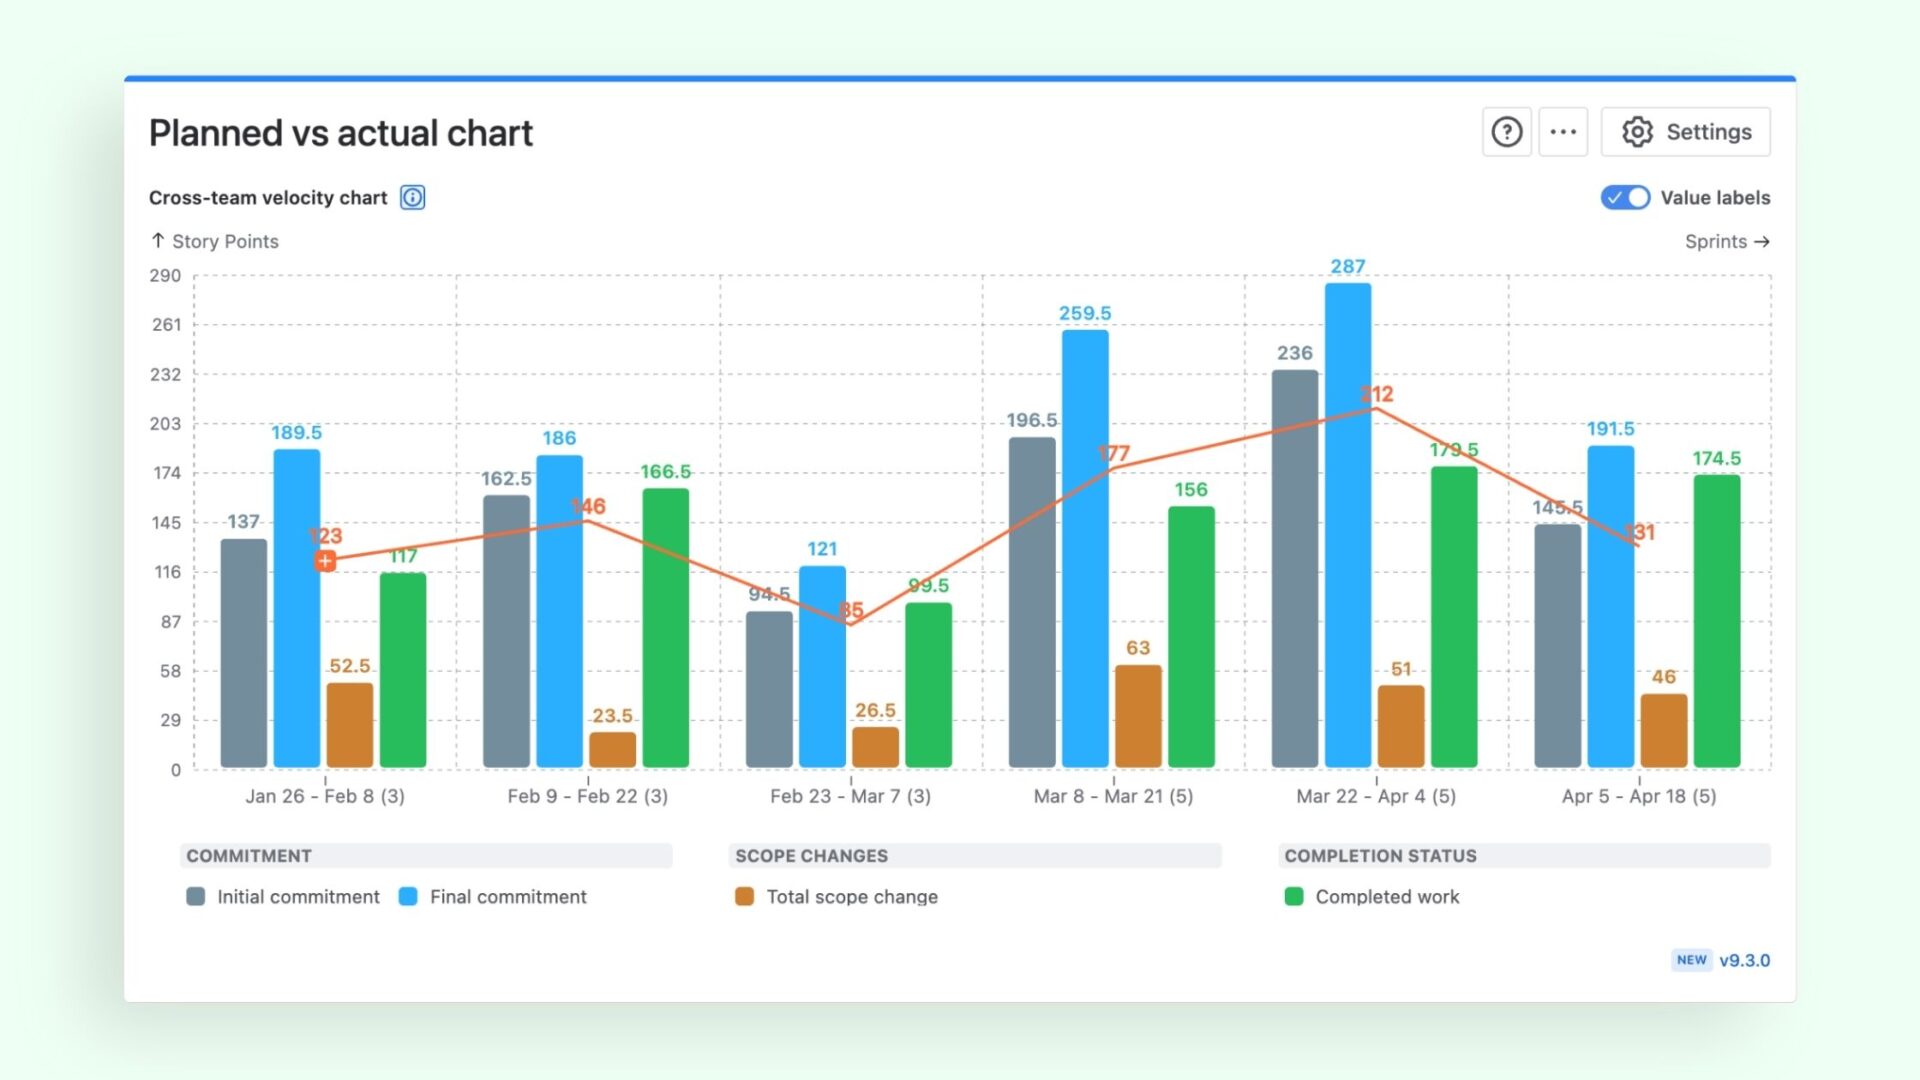
Remember, a planning process that never checks itself against outcomes keeps repeating the same misses.
Summary
Understanding how to plan capacity across multiple teams is a fundamentally different exercise from planning one team, and native Jira, for all its strengths, isn’t built for the multi-team layer. Boards are single-team, shared people get double-counted, dependencies hide until they hurt, and real availability never shows up on the board at all.
The way through is a deliberate, repeatable method: decide what capacity means for your context and pick a common currency, build an honest baseline for each team from its own history, normalize everyone into the same unit and horizon so the numbers can be added up, map incoming demand against that combined picture to catch overloads and dependencies early, and forecast in confidence ranges rather than fragile single dates.
Layer on a few durable habits (real slack, consistent record-keeping, early dependency sequencing, and a planned-versus-actual feedback loop) and cross-team capacity planning in Jira stops being a quarterly scramble. You get fewer over-commitments, earlier warning of bottlenecks, and release dates you can actually stand behind.