Project management in Jira is often a balancing act, where you need to juggle task tracking, dependencies, timelines, and team collaboration all within the same interface. While List View is a useful issue spreadsheet for Jira, it falls short in offering a visual representation of your project’s timeline, dependencies, and overall progress. Enter GanttTable for Jira—an innovative app that integrates Gantt chart functionality directly within Jira, transforming how teams plan and manage projects.
In this article, we’ll explore what GanttTable for Jira is, why Jira’s List View may not be enough, and what makes GanttTable the best solution for project management in Jira.
What is GanttTable for Jira?
GanttTable is a portfolio project management tool that works closely with Jira, providing an advanced issue spreadsheet for Jira to streamline work items (or issues). It enables Jira users to create and manage issues directly in an Excel-like table.
Additionally, the app also offers the Gantt chart functionality for enhanced project planning and tracking, visualizing project timelines in a Gantt chart format. As a result, GanttTable for Jira helps users facilitate more effective task coordination, dependency management, and progress monitoring.
1. One of the first to get the “Runs on Atlassian” badge
Among other DevSamurai’s solutions for Jira, GanttTable is one of the first to be eligible for the “Runs on Atlassian” badge. It is for applications on the marketplace built on Forge, Atlassian’s next-generation developer platform.
So, what is “Runs on Atlassian” exactly? If you’ve been sticking with us, it is a new badge for qualifying apps on its marketplace in May 2025, with a new transparency level and trust for all customers.
Besides being an app built on Forge, GanttTable must:
- Use only Atlassian’s cloud infrastructure for computing and storage.
- Offer data residency matching the regions of Atlassian apps.
- Enable customers to manage and, if needed, restrict data egress at any time.
For more information, please visit Atlassian’s Marketplace App Trust.
With all the effort, GanttTable is also one of the first solutions on the marketplace offering the issue spreadsheet for Jira that earns the Runs on Atlassian badge.
2. One of the best issue spreadsheets for Jira
GanttTable offers one of the best issue spreadsheets you can get for Jira at the moment. Its Excel-like tables empower you to browse, edit, and track Jira issues across multiple projects with ease.
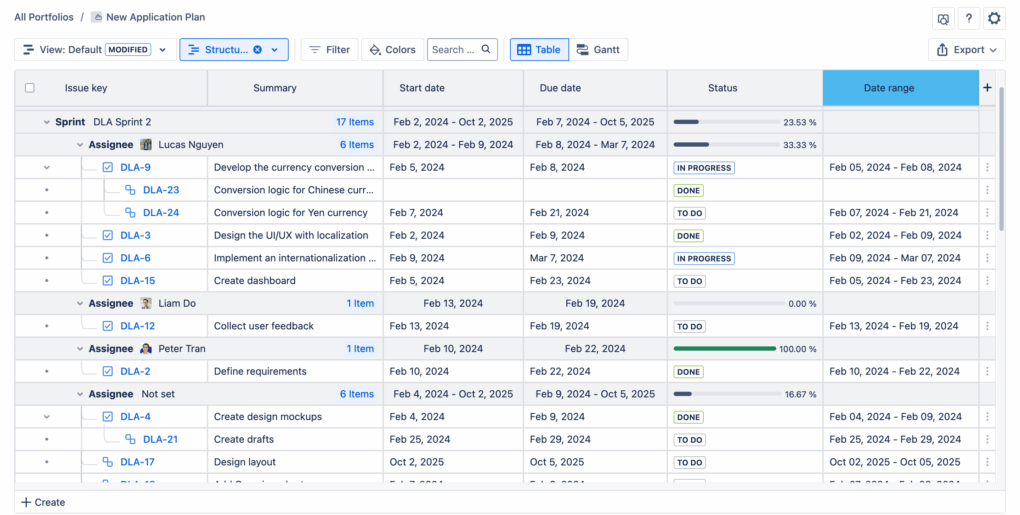
Additionally, GanttTable for Jira provides the Structure feature to create a unique way for you to visualize and manage your tasks, sprints, and projects in the most convenient way possible. Leveraging built-in Jira hierarchies, you can handle your tasks across multiple projects in a systematic way that you’re already familiar with.
Or, you can create custom structures to organize tasks and sprints, tailoring workflows to your or your team’s desires. You can also use your structures with your own rules to organize your work on the table based on Group, Total, and Group and total. Then, you can save this structure as a new view and use it again later.
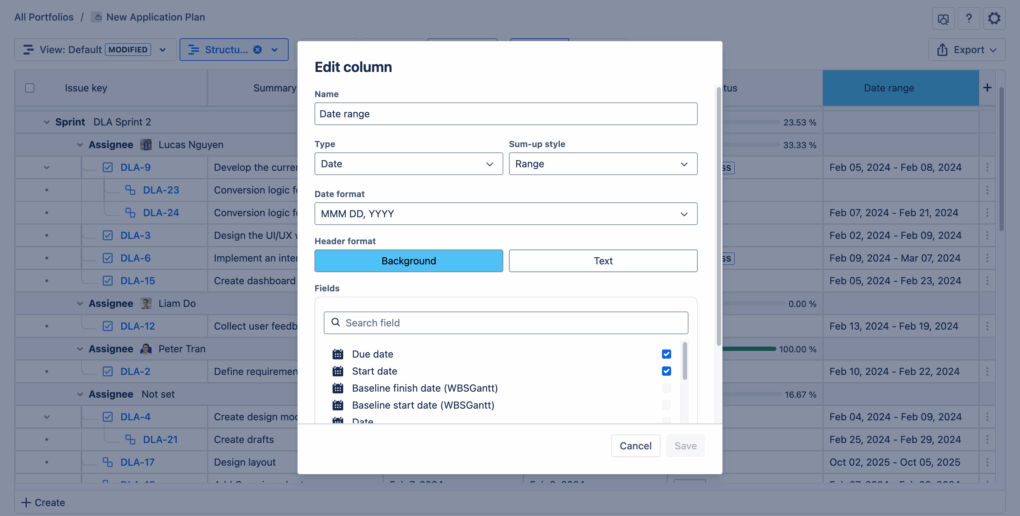
Besides Jira’s default columns, you can also add smart columns to show information in the issue details that’s calculated or derived from two Jira issue fields.
Depending on your needs, you can choose 5 prebuilt smart column types or add custom columns and leverage custom formulas to fulfill your needs.
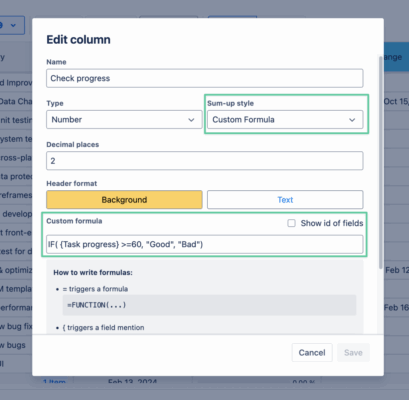
Other cool features to help you utilize the Table to the fullest:
- Custom Smart Columns: These columns can be added to the table to show calculated data based on three different types, using different Sum-up styles and Jira fields.
- Custom Formula: Users can create their own unique sum-up style for the smart columns.
- Color Mark: This feature allows users to quickly add colors to multiple cells or rows in the structure table at the same time.
- Copy & Paste: Let users easily update the data fields of different issues.
- Bulk editing: Users can select multiple issues and edit them in bulk.
3. A comprehensive Gantt chart to visualize your project planning
Along with an advanced issue spreadsheet for Jira, GanttTable also offers a comprehensive Gantt chart with all the capabilities. It is a project management tool that visually represents the timeline of a project, showing the start and end dates of various elements or tasks.
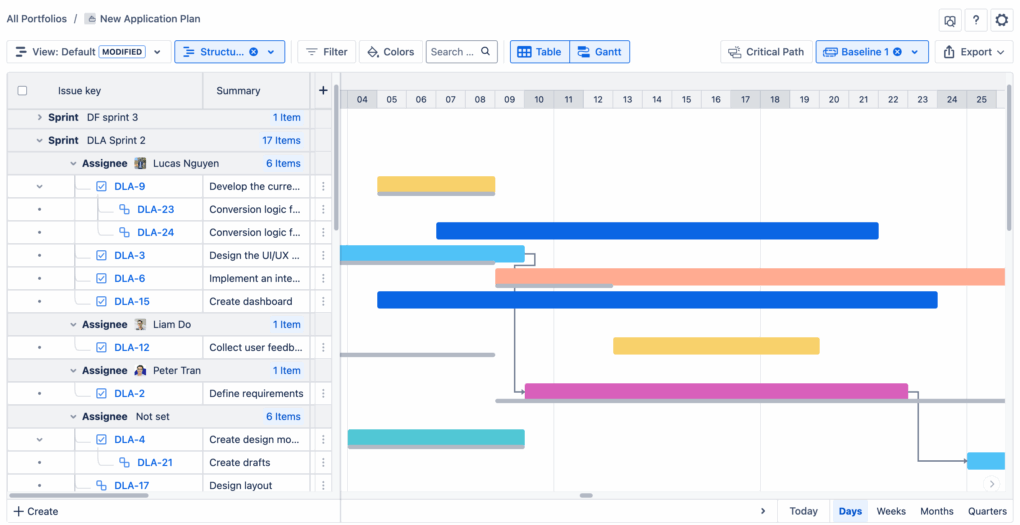
All the features you can use to streamline your project planning with Gantt:
- Critical Path: It highlights the sequence of tasks to determine the project’s overall duration, allowing you to focus on the most crucial activities to meet the project deadlines.
- Baseline: It captures the original project plan at a specific point in time, including the planned start and finish dates, task durations, and dependencies.
- Milestones: It is a point in time on a Gantt chart that represents an important event, achievement, or decision point in a project.
- Auto-scheduling: This feature automatically adjusts task dates and dependencies when you make changes to the Gantt chart, ensuring your project timeline stays up to date.
By combining the Work Breakdown Structure (WBS) with a Gantt chart, it merges the WBS’s hierarchical structure with the Gantt chart’s timeline and task dependencies, enhancing project visualization and management.
Why is using Jira List View not enough?
Don’t get us wrong, the List View feature can satisfy your most basic needs. It provides a basic, tabular representation of issues while showing task details (assignee, priority, status).
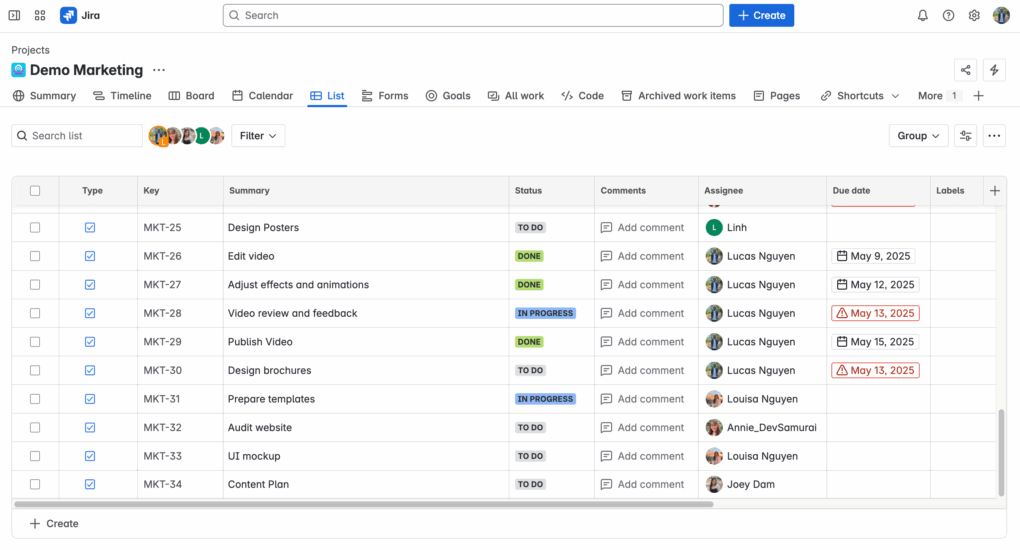
However, the Jira List View lacks many essential features that can make project management more efficient and visual. Here are some of its limitations:
- Lack of visual timeline: In Jira’s List View, you can see task names, assignees, and statuses, but there’s no clear way to see how tasks fit within a project timeline. Without a visual representation, it can be challenging to estimate how long a project will take or to determine which tasks are dependent on each other.
- Difficult task dependency management: Dependencies, which are crucial for large or complex projects, are nearly impossible to track in List View. There’s no way to visualize task relationships (e.g., which tasks must be completed before others can begin). This makes it difficult for teams to prevent delays caused by unfinished prerequisites.
- Limited progress monitoring: Although you can update task statuses (e.g., “In Progress” or “Completed”), Jira List View does not offer an easy way to monitor the overall project’s progress. You would need to manually check each task’s status, which can be time-consuming, especially in large projects.
- Lack of critical path and milestones: Key milestones or critical path tasks, which are essential for keeping the project on track, are hard to track in Jira List View. You would have to rely on manual lists or external tools to monitor these aspects.
What makes GanttTable stand out from the competition
GanttTable for Jira distinguishes itself from other project management tools and alternatives by offering a robust Gantt chart experience and an advanced issue spreadsheet for Jira. When compared to other popular Jira tools for managing issues in a spreadsheet-like view, like JXL for Jira, GanttTable offers several unique advantages for teams.
1. Bridge the power of Gantt visualization and spreadsheet view
One of the most noticeable differences of GanttTable for Jira lies in its core approach: combining the power of Gantt chart visuals and an Excel-like table.
With a Gantt chart view, the app allows project managers and teams to visualize the project’s timeline, dependencies, milestones, and critical paths at a glance. Meanwhile, members can hop to the app’s Table side to keep track, edit, and manage all Jira issues’ dependencies and project progress instantly.
All combined to deliver a streamlined experience for both task management and project planning.
2. Task dependency management
As mentioned, managing task dependencies is crucial for large projects. Dependencies show how tasks are related, ensuring that work is completed in the correct sequence.
Therefore, GanttTable for Jira shines here by providing a powerful, visual task dependency management feature. Dependencies are represented through arrows on the Gantt chart, allowing teams to see which tasks are blocking others quickly.
This clear visualization makes it easier to anticipate delays and manage project risks.
3. Enhanced UI and elevated experience
Since GanttTable also offers a Gantt chart, you might need to have a bit of a learning curve. However, once you’ve got the hang of it, it becomes one of the best visual experiences for project managers and members alike.
The Gantt chart helps users visualize the entire project timeline, progress, and dependencies in a way that a simple spreadsheet can’t match. With a simple yet modern UI, you can easily navigate through all the app’s features without breaking a sweat.
4. It is FREE, for now
Yes, you heard that right. All of those advanced features of GanttTable with issue spreadsheet for Jira are currently free. You can get GanttTable now to manage tasks effectively and plan your project timelines without spending anything (except for the flat fee from Atlassian).
Besides, the app is still in development stages, and we keep improving it in every single patch, with more advanced features to make your work a lot easier.
However, the app won’t stay free forever. Once we’ve made sure that GanttTable is in its complete edition, it will become a commercial app, caring to maintain reliable servers and ensure smooth performance, even during peak usage.
But don’t worry, we’ll provide competitive pricing plans on the market.
Final thoughts
GanttTable for Jira offers a comprehensive and seamless solution for teams looking to manage their projects more efficiently. While Jira List View is an essential tool for basic task tracking, it falls short in providing the visual and functional capabilities needed for larger, more complex projects.
Therefore, GanttTable bridges this gap by providing a robust Gantt chart interface within Jira, allowing teams to visualize tasks, manage dependencies, track progress, and ensure timely delivery.
If you’re looking to enhance your project management workflow, GanttTable for Jira is the tool to try. With its intuitive interface and powerful features, it’s the best way to manage your Jira issues while maintaining complete visibility over your project’s progress.